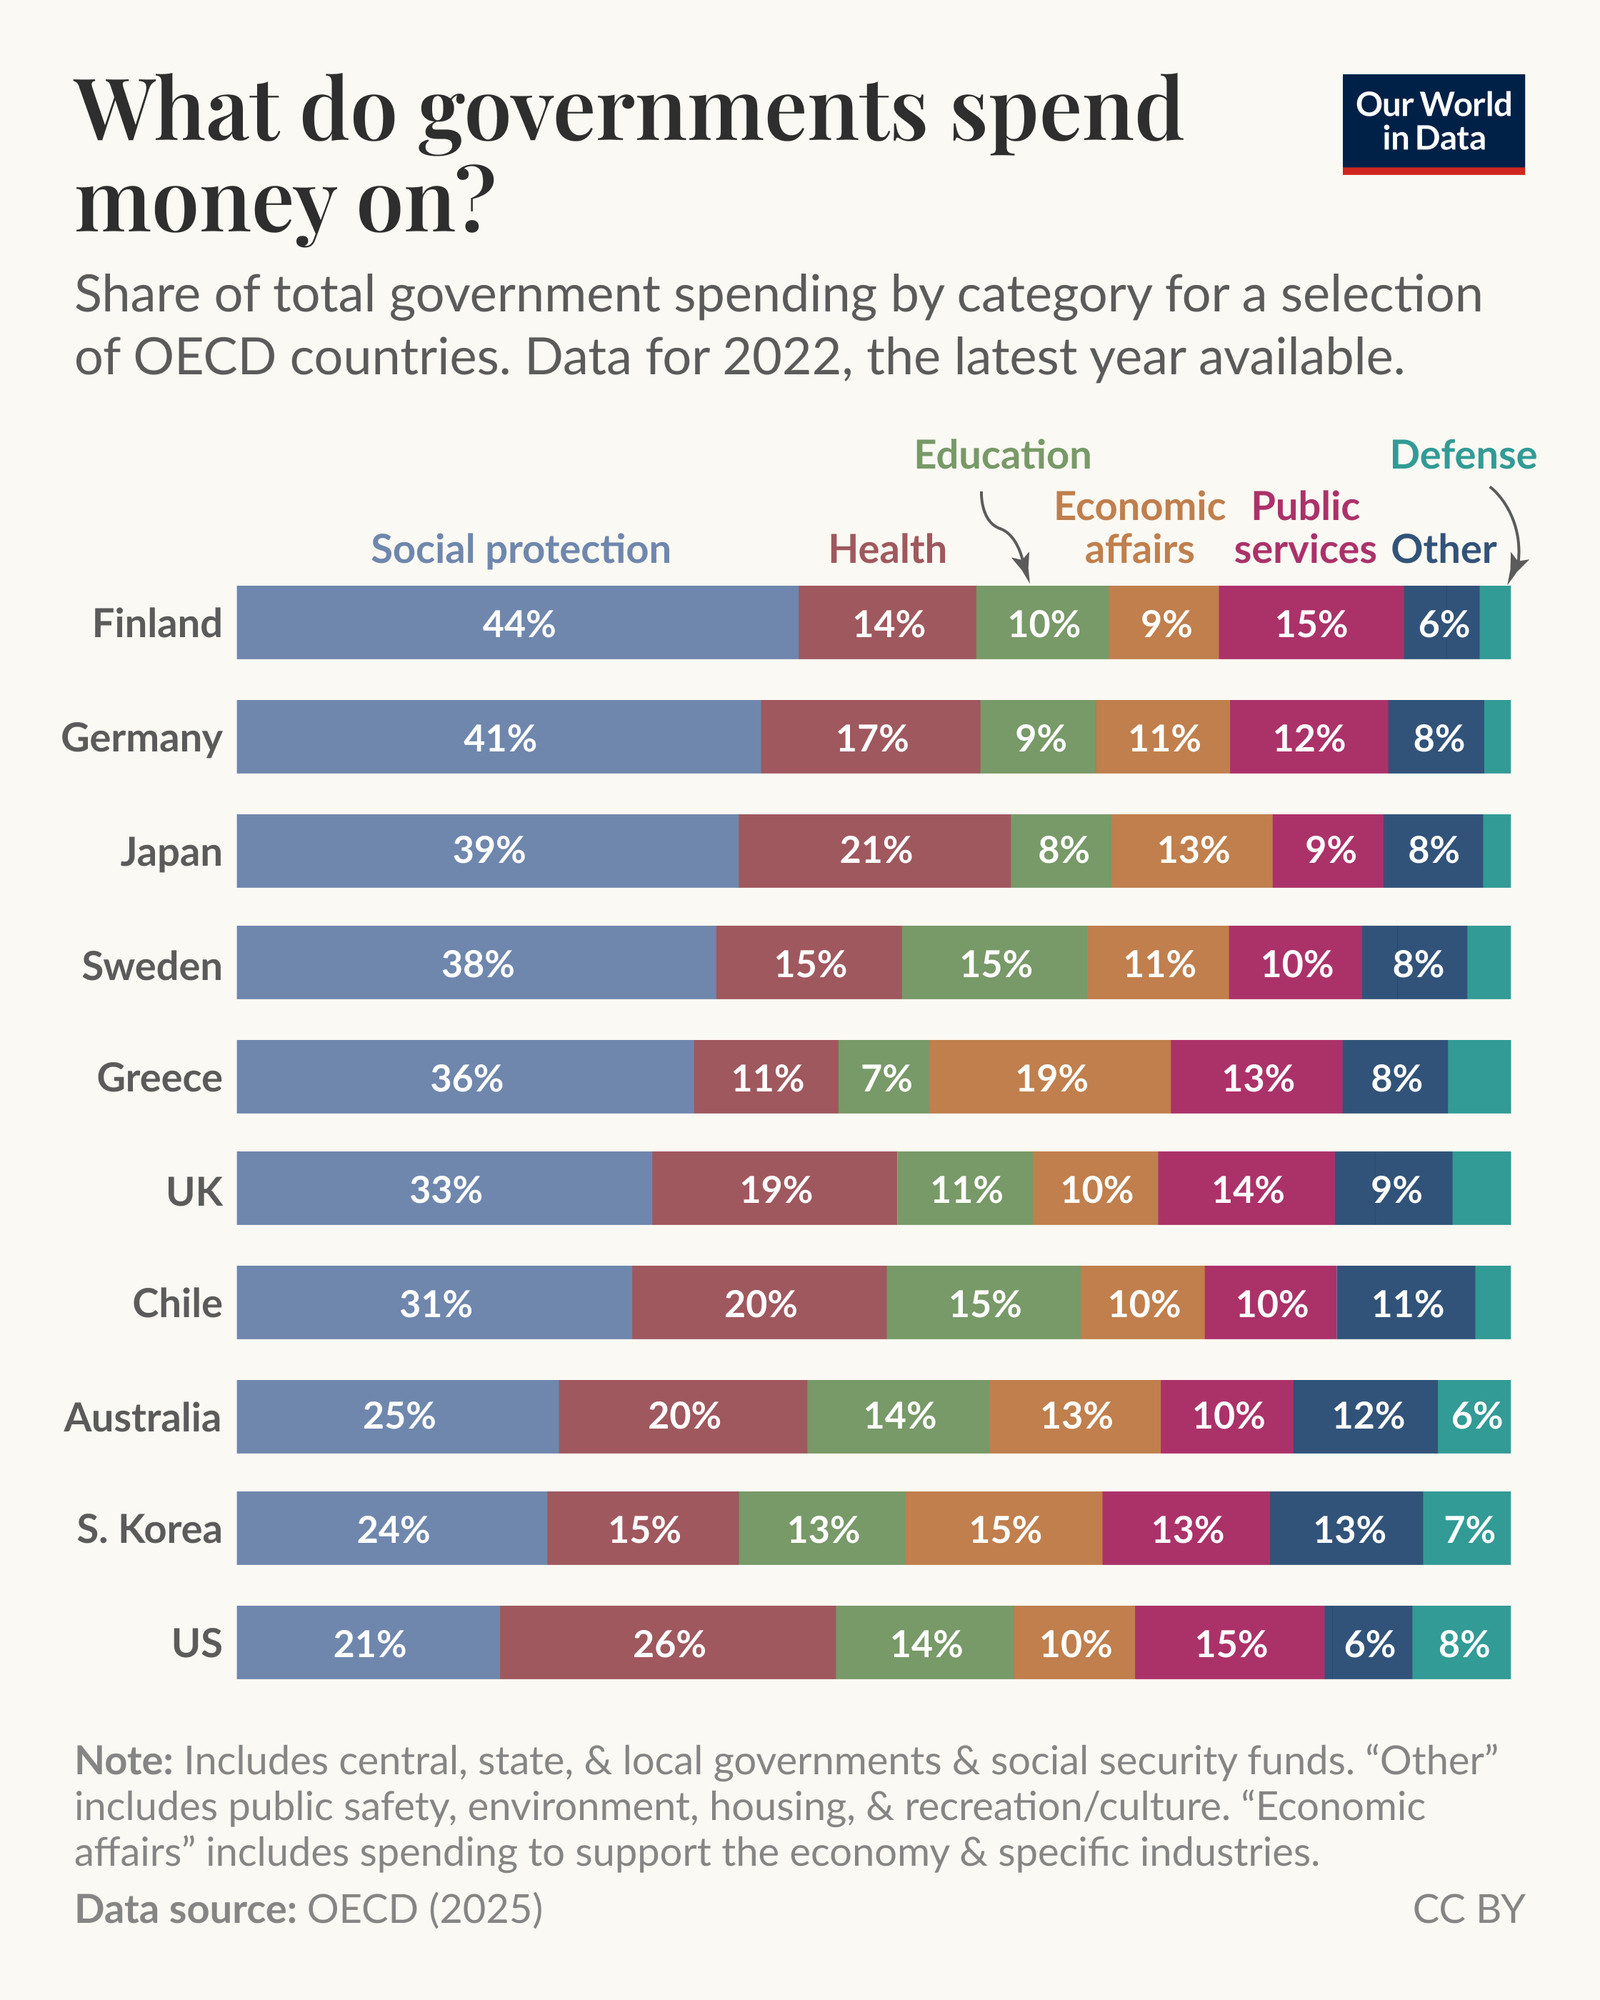
In the chart, we see spending in different categories, such as defense, health, and education, as a share of total government spending. This is shown for a selection of OECD countries.
For some categories, such as public services, the share spent is similar across countries: it ranges from a low of 9% in Japan to a high of 15% in the US and Finland.
Public services includes things like the running of core government functions, foreign aid, and paying interest on government debt.
In other categories, such as social protection, the difference across countries is much larger: from a low of 21% in the US to a high of 44% in Finland.
Social protection includes things like pensions, unemployment benefits, disability support, and other benefits.
It’s important to keep in mind that the total amount of government spending varies a lot across countries, so even though the share we see here might be similar, the actual spending might be far different.
One difference between the sources is that what we show here from the OECD (8%) includes spending by central, state and local governments, while the value from USAFacts (13%) is only federal government spending.

Comments
Public services includes things like the running of core government functions, foreign aid, and paying interest on government debt.
Social protection includes things like pensions, unemployment benefits, disability support, and other benefits.
This update was led on our team by @bertharohenkohl.bsky.social and @parriagadap.bsky.social.
https://usafacts.org/answers/how-much-does-the-us-spend-on-defense/country/united-states/