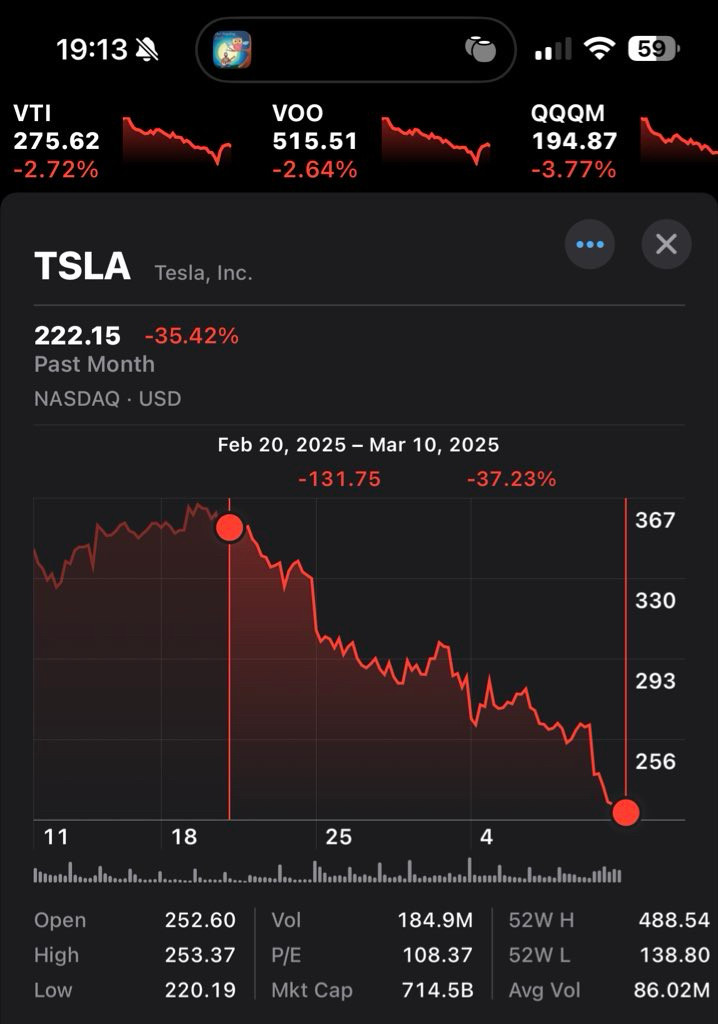
So yes, in that sense it's misleading. I meant to illustrate concentration risk in a single stock (TSLA) compared to VTI/VOO/QQQM in the ticker above, not make some political statement.
Thanks for replying! I see, the X post included more context — the one here looked just like 3-4 other very similar ones I'd seen in 10 minutes on bluesky, all politically-focused.
I still think bad charts are bad charts; but your intent here was better; good luck.
Bro it’s not even a car stock. You’d have a better ROI after this debacle on a Wendy’s franchise if you’re interested j. Investing. They aren’t selling cars anymore
Absolutely love it this guy is getting what he deserves and I mean I'm not a mean guy I'm a common sense guy if my neighbor wants a little bread and I have it I'll give it they need some money and I can have extras I will give it this guy Musk does not give a flying fuck but his time's coming

Comments
We desperately need more honest news.
Check TSLA before the election.
Maybe it'll keep dropping, but *let's see*, not declare victory and reinforce the political divide.
I posted the same graph on both X as well as here. People here are very anti TSLA / Elon so they've run off with their own narrative.
The range in the stock graph makes a little more sense with context- i.e. it's the date I made the decision to liquidate my TSLA holdings.
I still think bad charts are bad charts; but your intent here was better; good luck.
https://www.forbes.com/sites/stevebanker/2025/02/11/tesla-again-has-the-highest-accident-rate-of-any-auto-brand/
The shine is off. The honeymoon is over.