
Three charts based on our #C3S ERA5 dataset you shouldn’t miss this month:
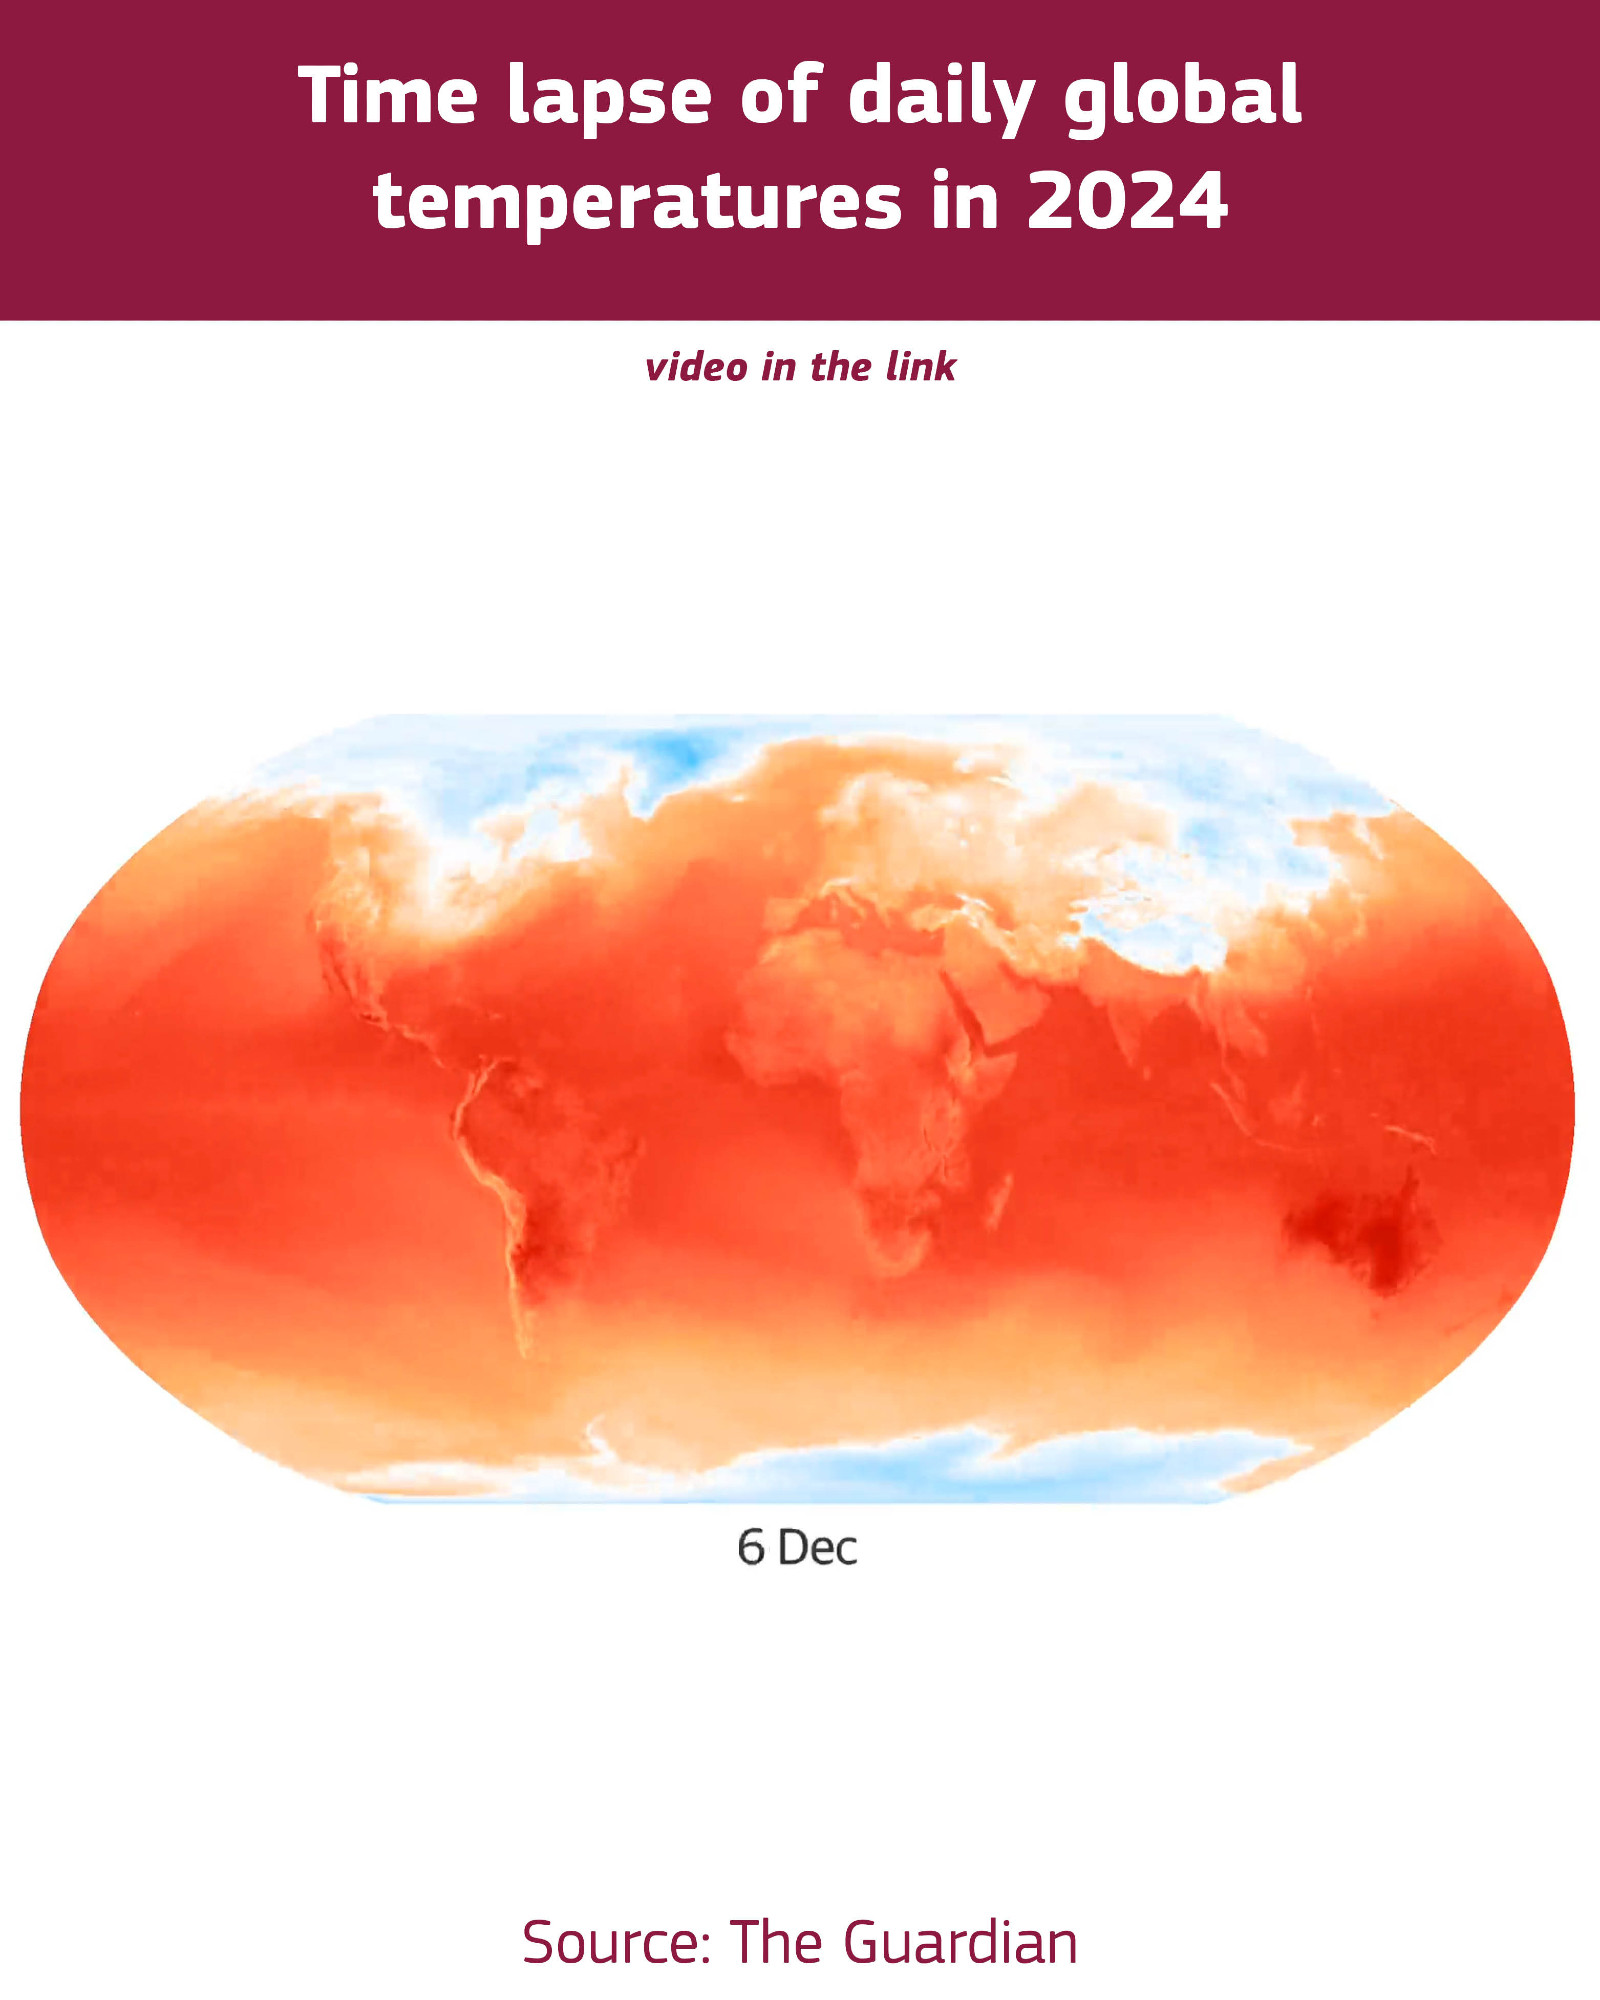
📈 Time lapse of daily global temperatures in 2024 – @theguardian.com
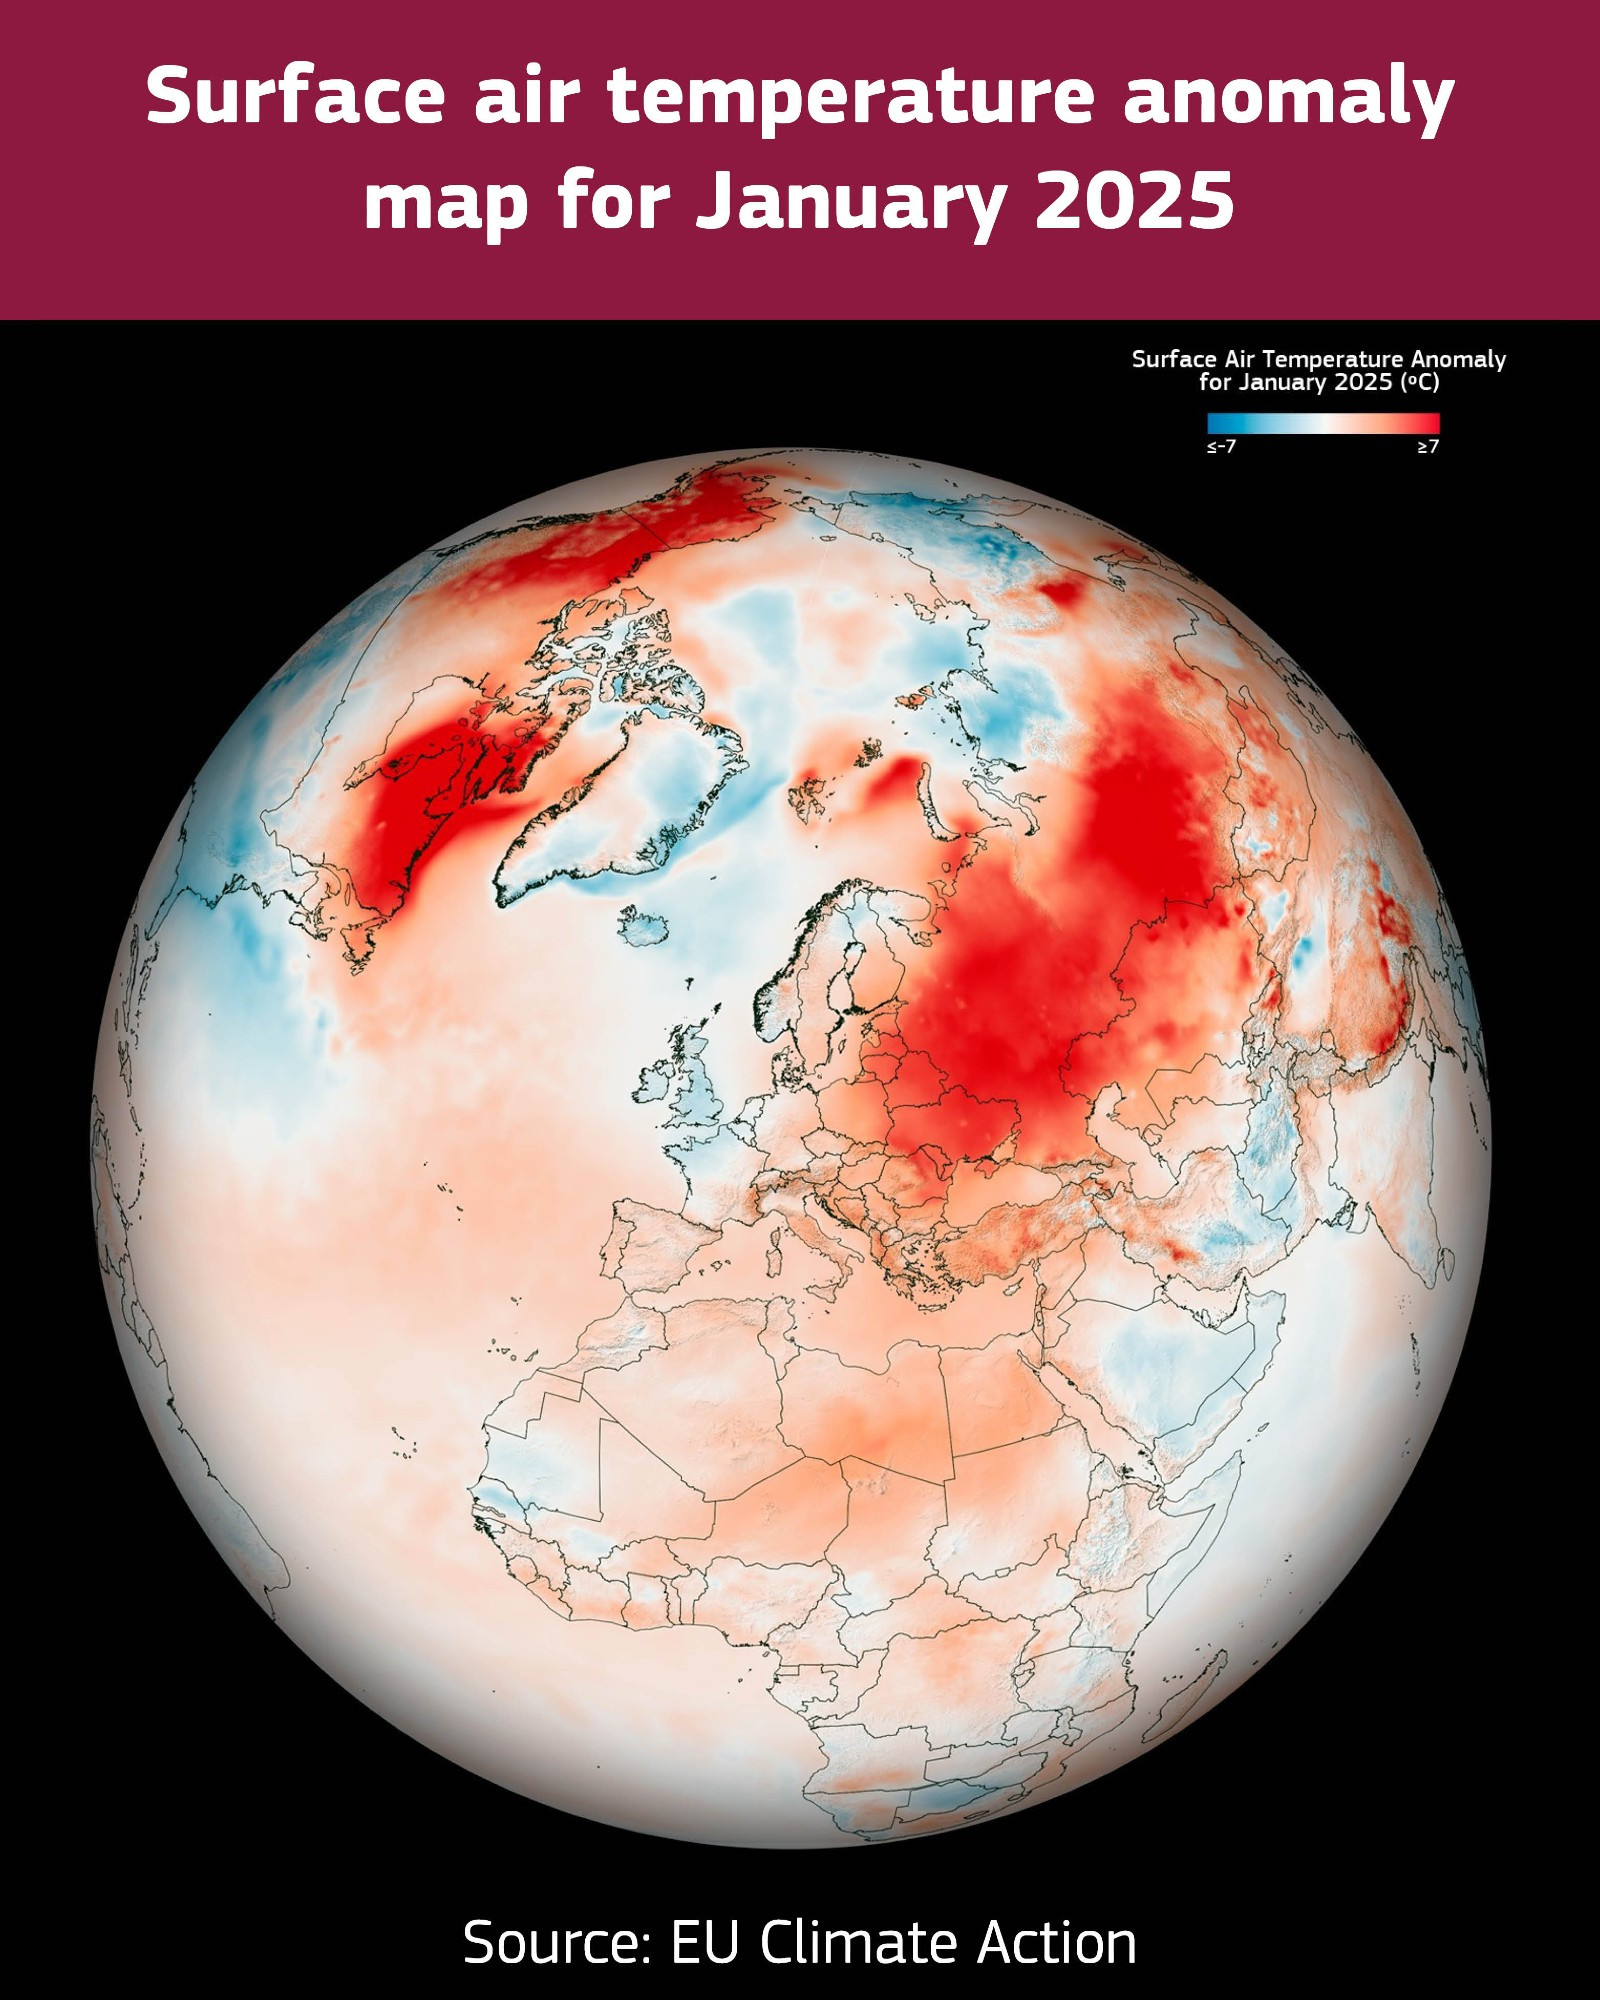
📈 Surface air temperature anomaly map for January 2025 – @euclimateaction.bsky.social
📈 Global surface air temperature anomalies for January – #C3S
📈 Time lapse of daily global temperatures in 2024 – @theguardian.com
📈 Surface air temperature anomaly map for January 2025 – @euclimateaction.bsky.social
📈 Global surface air temperature anomalies for January – #C3S
1 / 3

Comments
1️⃣ https://bsky.app/profile/theguardian.com/post/3lilxfzrjnt2e
2️⃣ https://bsky.app/profile/euclimateaction.bsky.social/post/3lhvidmoloc2r
3️⃣ https://bsky.app/profile/copernicusecmwf.bsky.social/post/3lhiqqdkwas2n
Read the latest Climate Bulletin: https://climate.copernicus.eu/january-2025-warmest-january-and-lowest-arctic-sea-ice-extent-month
👉 https://climate.copernicus.eu/what-copernicus-climate-change-services-era5-reanalysis-dataset-and-what-can-it-do-you
👉 https://cds.climate.copernicus.eu/#!/home