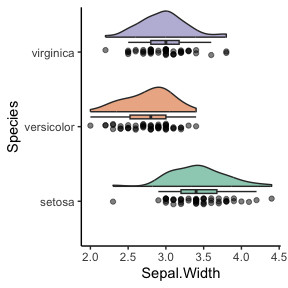
Today I learned that combining a density plot with a jitter / dot plot is called a "raincloud" plot. And also discovered the {ggrain} package. Very nice, I remember doing it almost by hand in base R. #rstats https://www.njudd.com/raincloud-ggrain/
Comments
Log in with your Bluesky account to leave a comment
I have this idea (probably somebody did it already) of a “sandpile plot”. The samples fall and form a sandpile and are allowed to move laterally only by their diameter.
Very crude example. The exact sample values are the red dots (normally not plotted), circles have some arbitrary diameter to give the plot some volume (otherwise it would not be a pile). They are adjusted in the range of diameter, otherwise the sand would have ∞ friction and won't pile-up nicely.
OK, but shifting samples is equivalent to some form of smoothing, so it actually changes how the data looks. This should be avoided, because showing individual samples suggests that you are showing the actual values – while in fact, you are not.
Hmm, that looks a bit like a beeswarm. Beeswarms are used to show the distribution of samples, a bit like density plots, but they show individual data points. Points are not allowed to shift, though, and usually the visualization is symmetrical.

Comments
The closest layout to "sandpile" is probably "weave" or "swarm" (except that the latter guarantees exactly correct x position)
See https://mjskay.github.io/ggdist/articles/dotsinterval.html