
So I know folks have heard the news about an exoplanet that might be “teeming with life”? 🌱
I created a series of infographics that aims to cover the key points of the research findings + some of the area where scientists are sceptical! 🧐
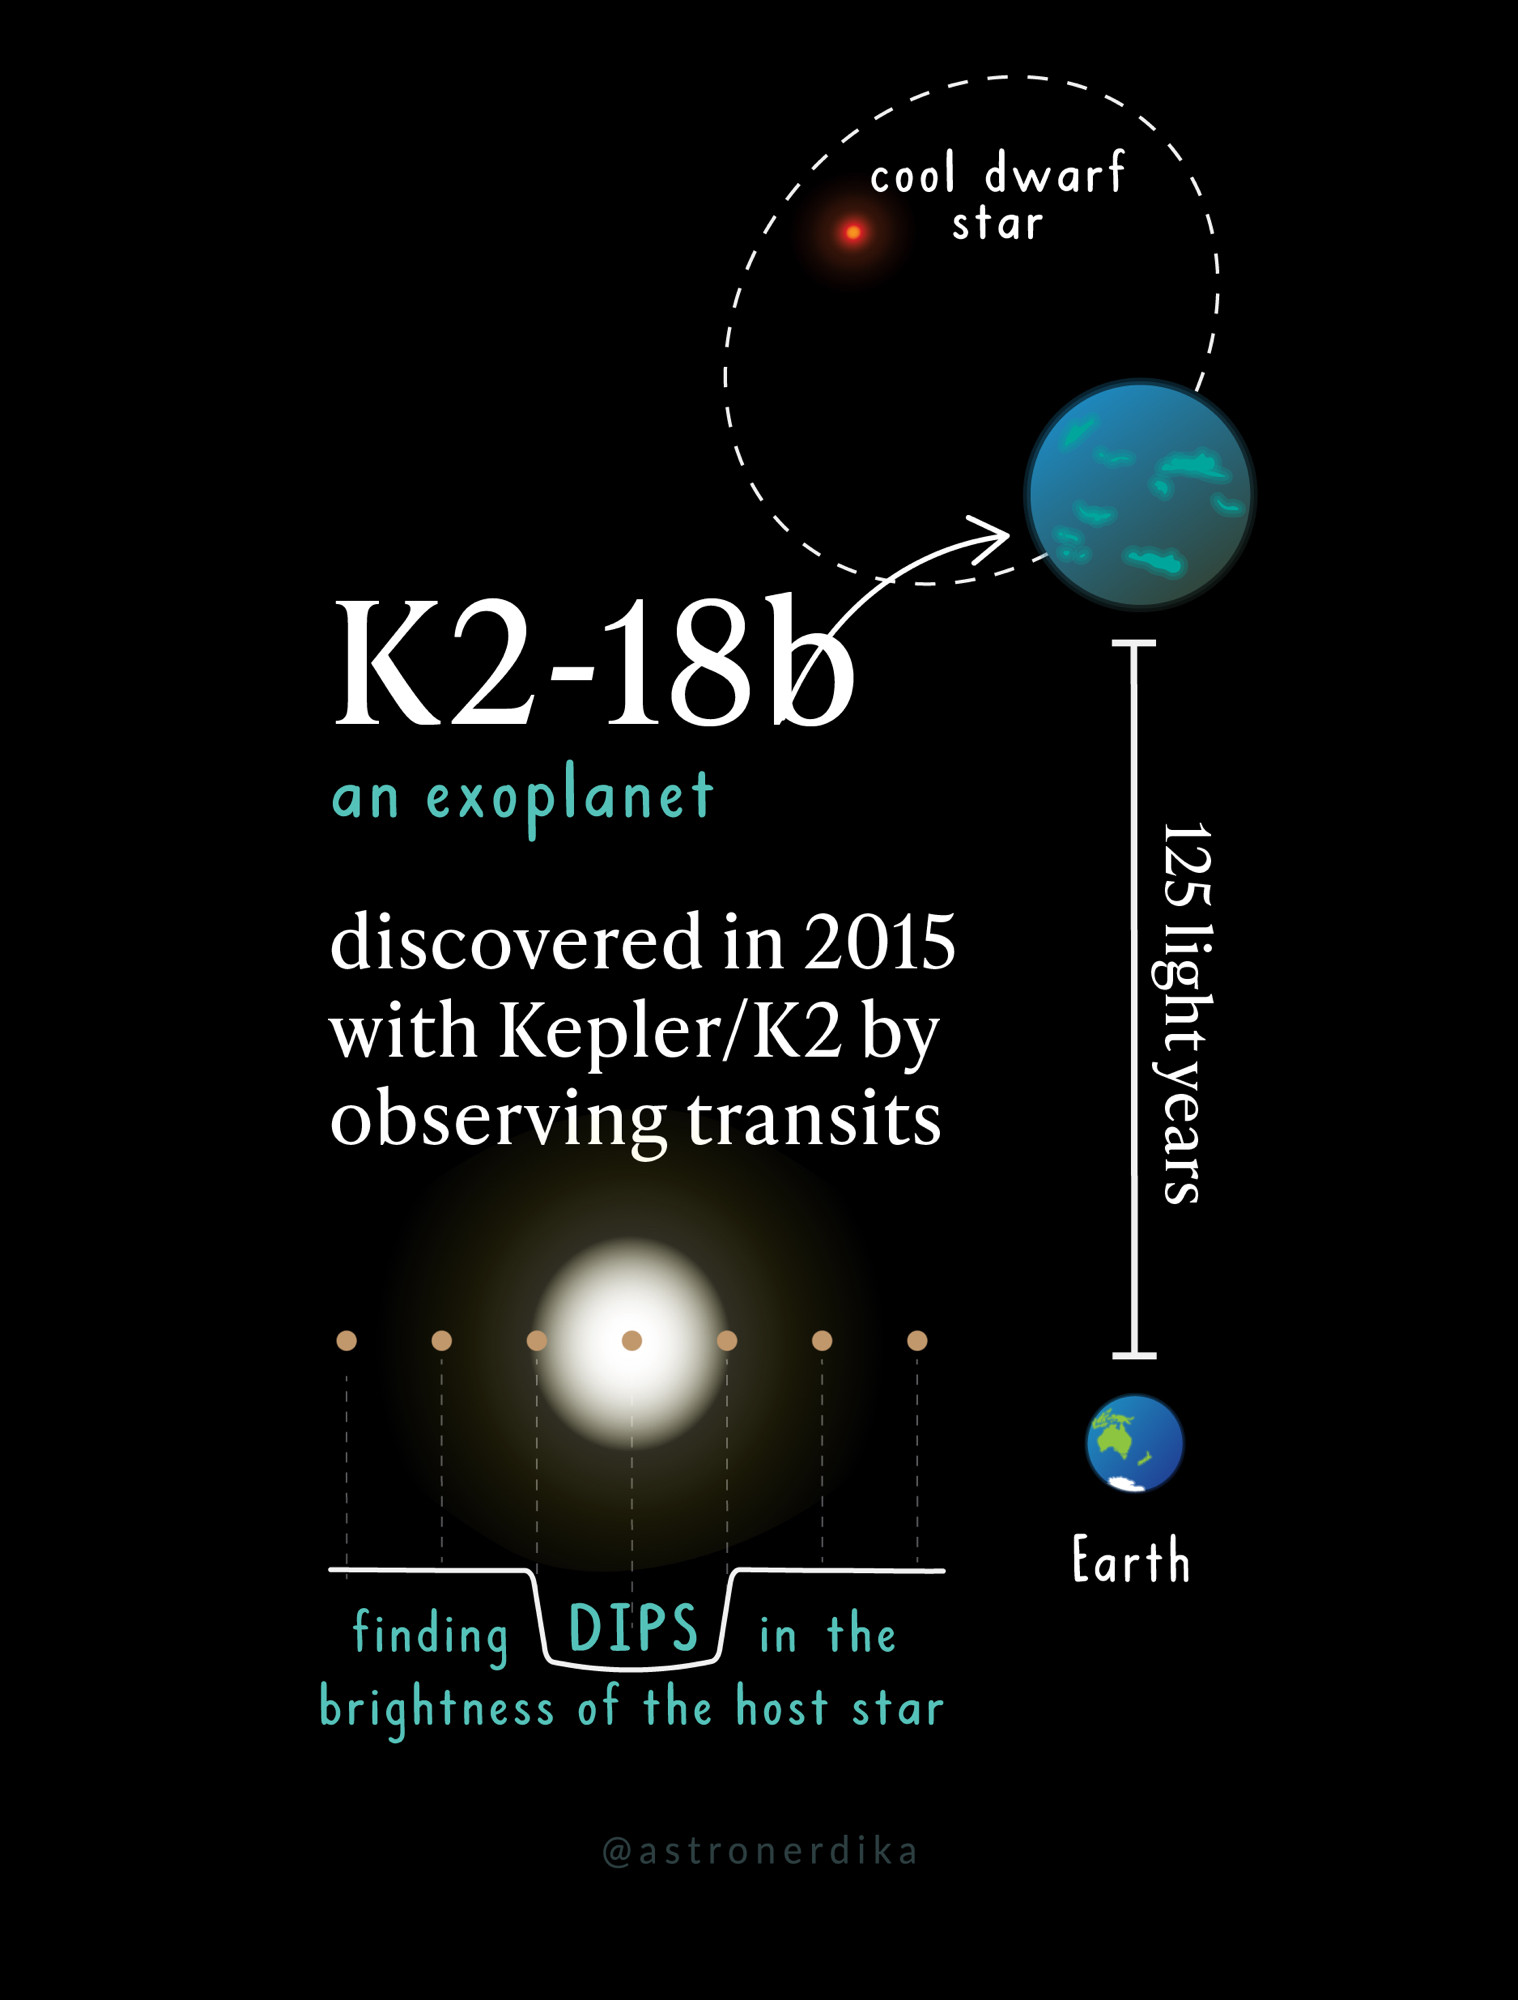
Meet K2-18b! 👋
#astronomy #exoplanet #scicomm
I created a series of infographics that aims to cover the key points of the research findings + some of the area where scientists are sceptical! 🧐
Meet K2-18b! 👋
#astronomy #exoplanet #scicomm
Comments
Less clear for me (not for you to answer but what this noob still doesn’t know after your great post) are how the light/photons become spectrum graph(s? - one for the whole telescope at some duration of detection?), and what “1 in X” are in std devs?
They compare the amount of light detected at a given wavelength from 1) host star and 2) the planets atmosphere, and calculate the % drop
This figure is from the paper. The Dots are the observed data. Some of the data has very large error bars!
That’s the model they fit for to get the actual spectrum.
Also, you are not a “noob” for asking, I didn’t explain this in the infographics!
And I’d need an #exoplanet to chime in for the details on the actual JWST measurements.
Some of the graphics include a lot of text, but I’ll do my best to summarise.
Hint: Alt Text has much more room, you can copy & paste longer texts like the sources at the end into it.
Methane + Carbon Dioxide*
Is this model too simple? 🤔
*CO_2 was NOT found in some other studies but CH_4 is still found quite confidently 💪
These Qs are tricky to answer 😅
#astronomy #exoplanet
K2-18b: Hey that planet looks nice!
20th Century: Happens
K2-18b: oh god.
21st Century: begins
K2-18b: oh god!
I like to think about that fact that if any life is observing us right now from 100 million light years away, they probably wouldn’t want to visit this planet 😂
I especially liked the DIPS.