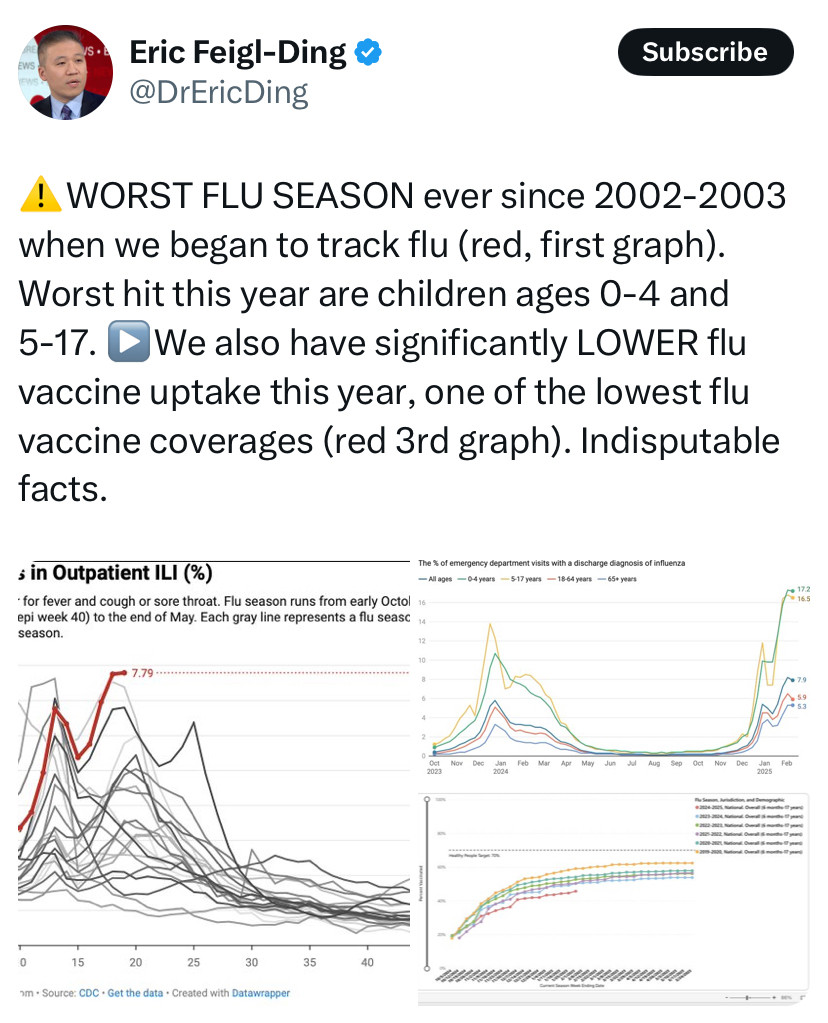
3rd graph is preliminary within season estimates. See this report for final season estimates https://www.cdc.gov/fluvaxview/coverage-by-season/2023-2024.html
Shows coverage for children lowest in 12 seasons last year and preliminary estimates this year (your graph) show lower again.

Comments
Shows coverage for children lowest in 12 seasons last year and preliminary estimates this year (your graph) show lower again.