Why was this one generated or more precisely what for? I won't ask for the creators name, but I have to believe even the worst were created with a point in mind.
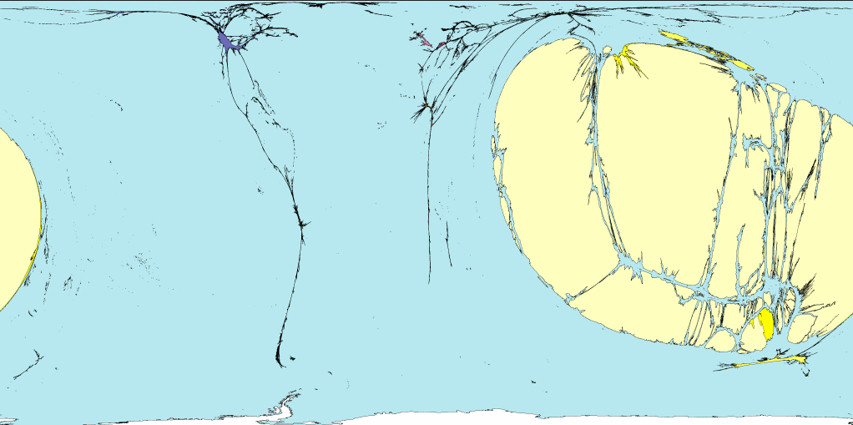
Why is Antarctica so big? I guess it's not a "country" so doesn't count, and thus can be represented in any way chosen. Or maybe there is a lot of Indonesian speakers there?
It looks like they’re trying to plot both the total rate of deaths and the change in the rate, but… actually, I’m coming around to this. It’s the perfect post.
I use this one and the average height ones (male and female) for data talks with my 6th graders. First time I did the male height one, one students response was “ew”. 😎
wow, that's a mind flip! Creates an implicit bias right off the bat and for some, it would mean that they have been conditioned to a lie as their initial belief set... and flip from 'bad' to this --> genius viz for dark psychology.
As Mark Twain (mis)quoted Disraeli, "lies, damn lies and statistics." Twain credited Disraeli but the first occurrences of the phrase post-date his death so the actual origin is unclear.

Comments
You can set up a reminder:
Go to your profile settings, click "Accessibility" under Basics, make sure "Require alt text before posting" is toggled on.
How can we ever know?!?!?
At least I understood the ‘electricity usage in Western Europe: 1500-1537’ chart! 🤣
Covid Death Tornado
I hope most of the ones about men are ironic, if not dear lord those people need therapy.