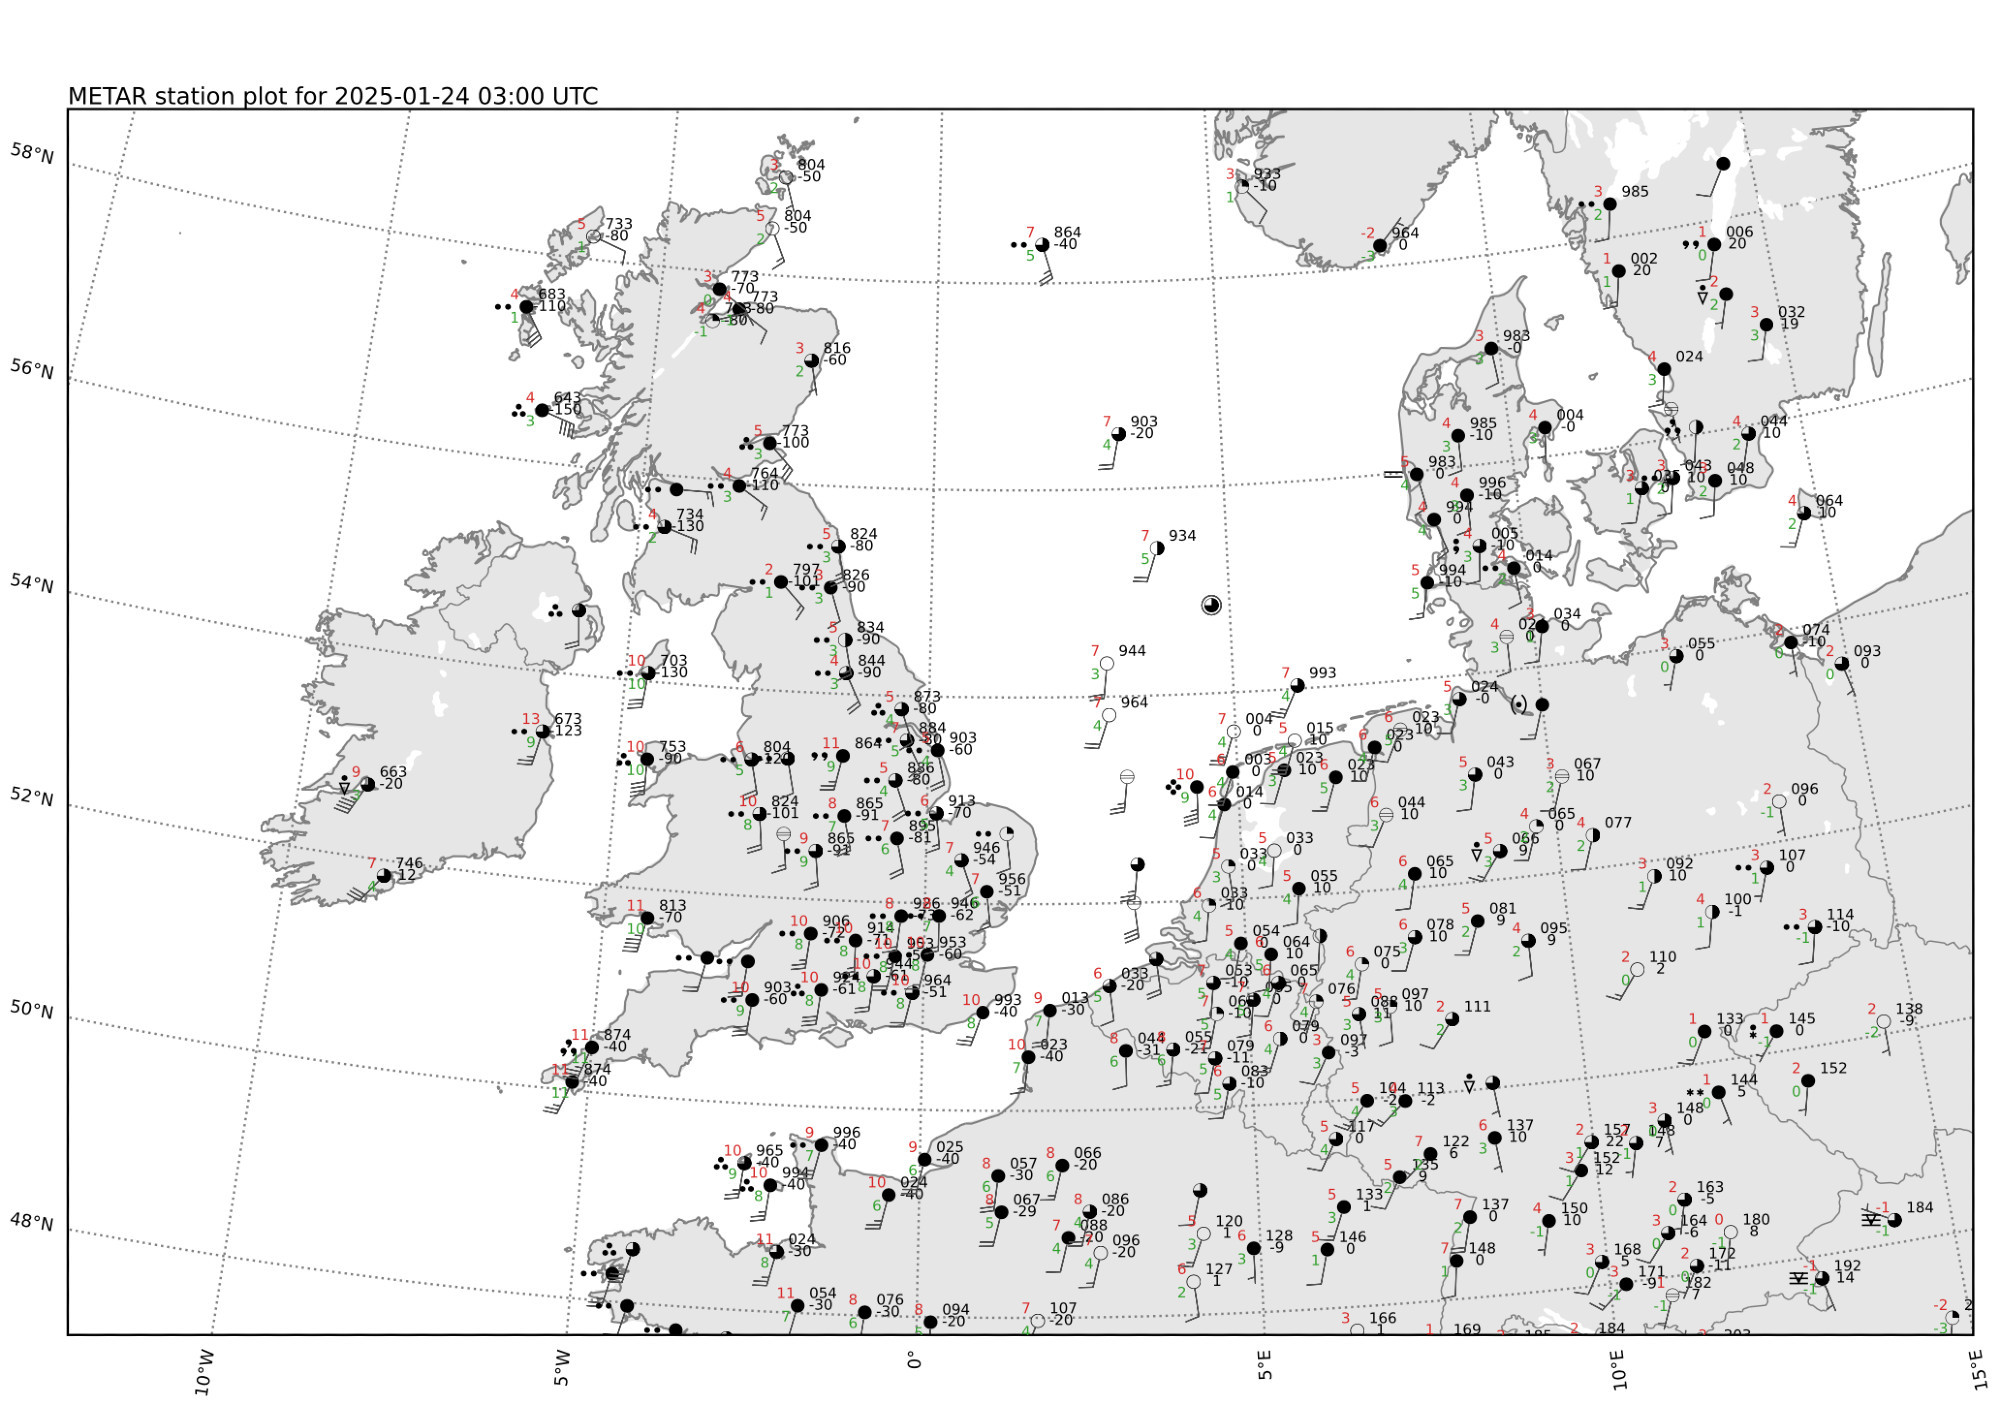
Updating our weather forecasting course at Wageningen University with the recent storm. Hardly anyone makes station plots like these anymore, but luckily there is Python and some open data! (the goal of this map is to let students draw do their own surface + frontal analysis)
Comments