
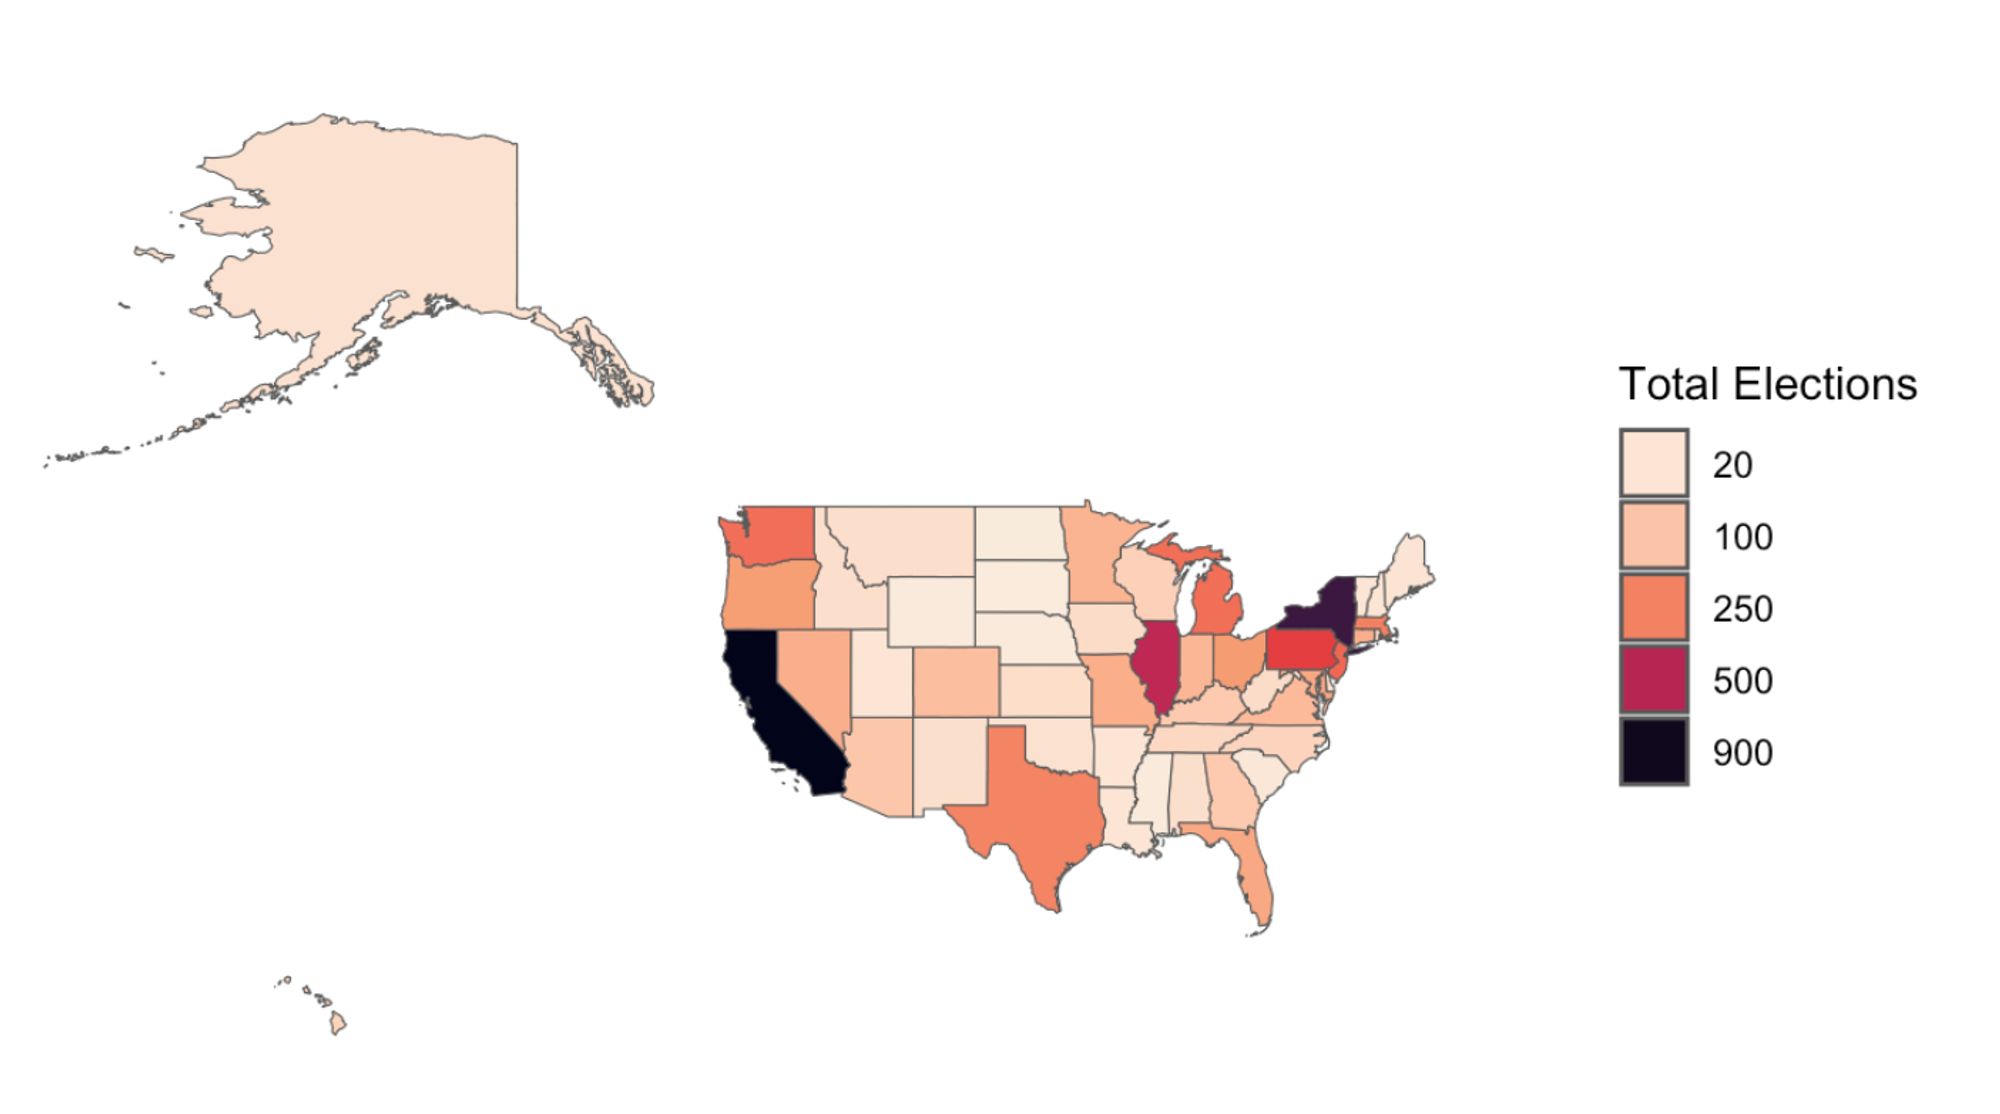
Last semester, I taught myself how to plot maps using R. Because I suffered a bit too much through this process, I figured I would make an easy tutorial for choropleth maps like the one below. I put this tutorial up on my website: https://sites.google.com/view/egarciaferres/portfolio/choropleth-map-tutorial
I hope this helps someone!
I hope this helps someone!
Comments
If you ask me, whoever chose to not name this graph *Lolliplots* missed big time. 🙄
Anyway, here is the code: https://sites.google.com/view/egarciaferres/portfolio/lollipop-plot-tutorial