
Reinsurance data offers one of the best proxies of the worsening climate crisis.
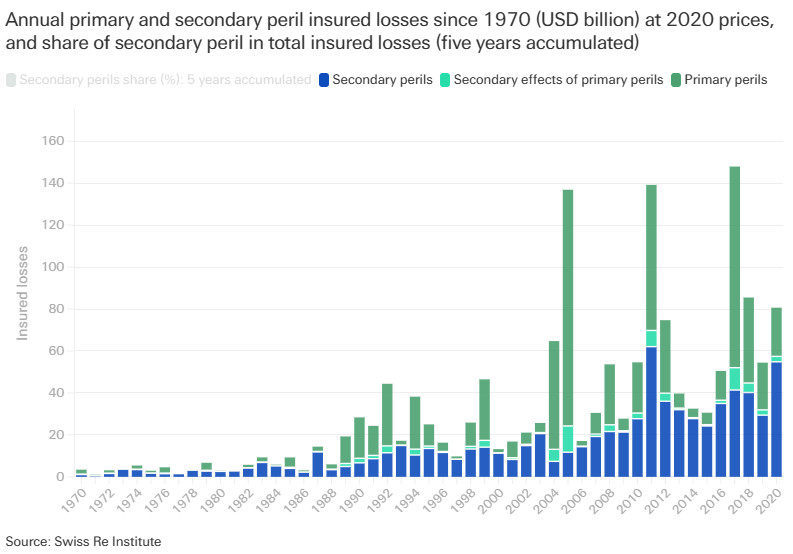
This chart shows the evolution of insured losses related to natural disasters - from almost none, to a significant amount every year.
This chart shows the evolution of insured losses related to natural disasters - from almost none, to a significant amount every year.
Comments
I can't understand why people still can't see what's happening.
FFS.