
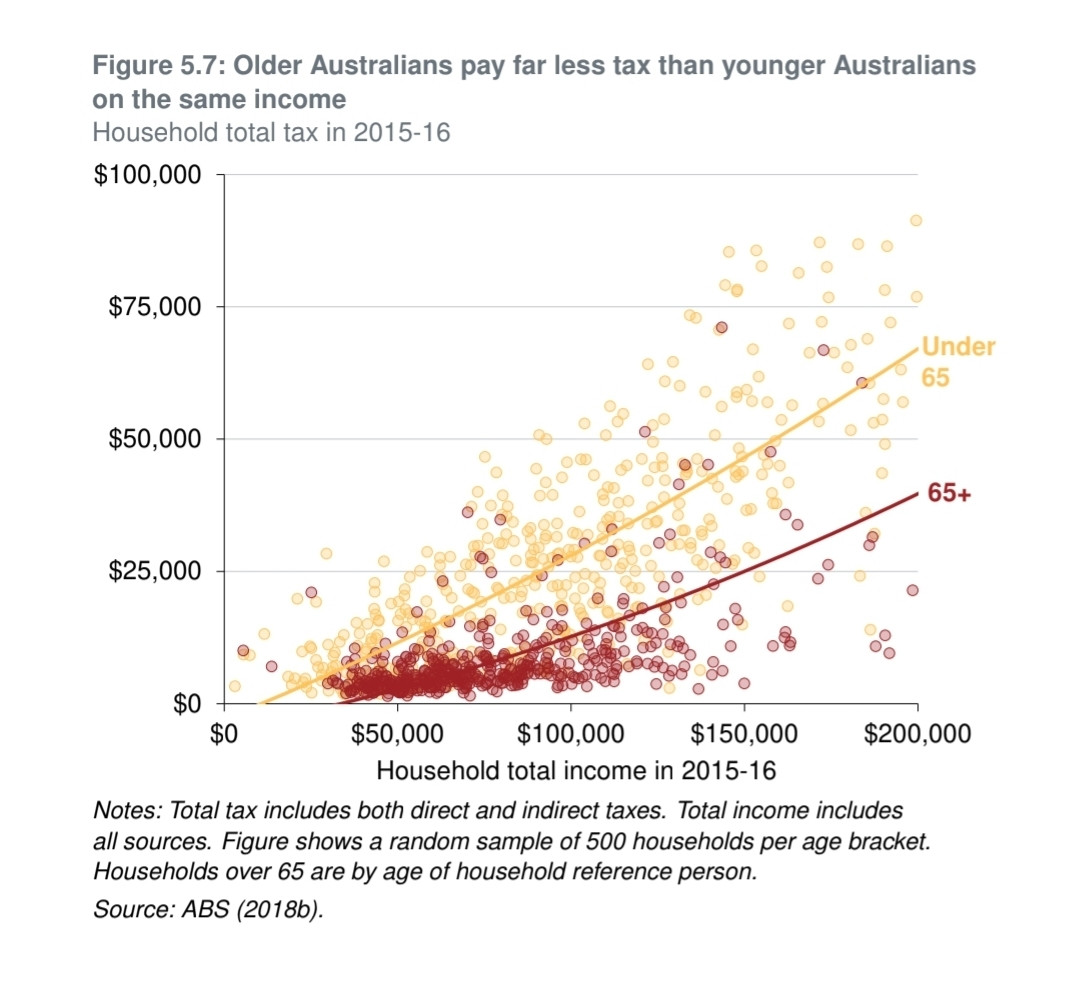
Incredible chart showing how age influences the amount of tax you pay for a given level of income. Difference driven in large part by super concessions/investment earnings
Regressive, expensive and without any compelling equity justification
Regressive, expensive and without any compelling equity justification
Comments