My existing pipeline works through {MSstats} in #rstats #rstudiofrom @bioconductor.bsky.social which needs precursor and product ions to quantify proteins across conditions. Running DIANN v2.0 through command line requires the --export-quant switch to include fragments in the .parquet output.
Getting .parquet file into #rstats was easy. There’s a package {nanoparquet} on cran. Function read_parquet() just pulls in the table. Actually all columns come in with correct type, no more sequences coming in as factors!
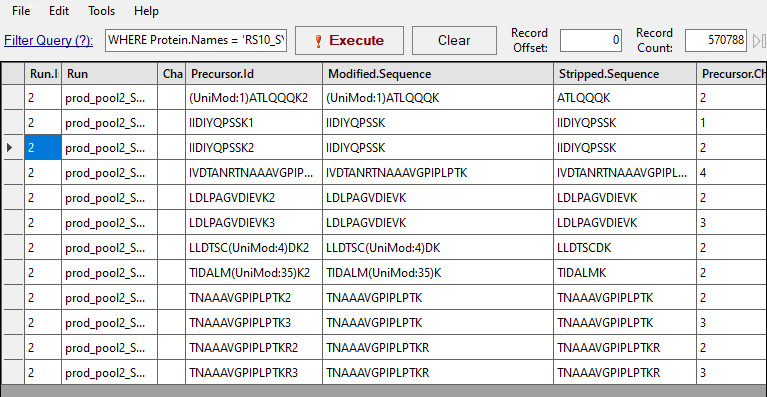
Once data is in it needs some tweaks to get the columns named in the way MSstats expects. Fragment data is now included in separate columns and has to be concatenated into a single column for MSstas.
Lastly I compared protein quantification obtained from DIA-NNv2.0 and DIA-NN v1.9. Plot shows y=y line in black, regression line in blue, data points in red with high transparency. Quantification is fairly tight. DIA-NNv2.0 underestimates wrt v1.9.

Comments