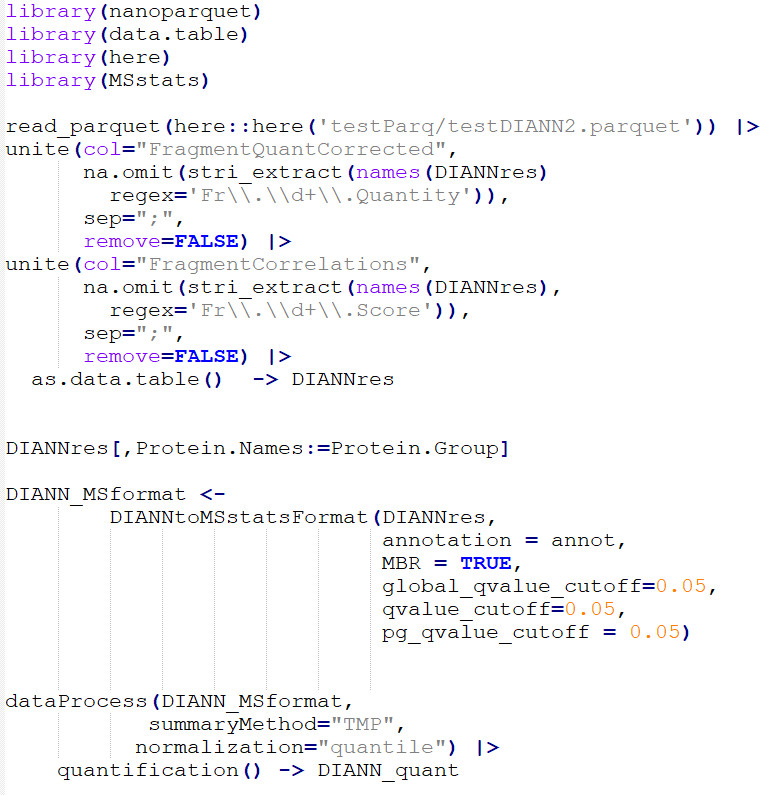
Once data is in it needs some tweaks to get the columns named in the way MSstats expects. Fragment data is now included in separate columns and has to be concatenated into a single column for MSstas.
Comments
Log in with your Bluesky account to leave a comment
Lastly I compared protein quantification obtained from DIA-NNv2.0 and DIA-NN v1.9. Plot shows y=y line in black, regression line in blue, data points in red with high transparency. Quantification is fairly tight. DIA-NNv2.0 underestimates wrt v1.9.

Comments