
New paper fresh from the oven 🧑🍳🔥
1/ 🚍 We look at how predictable bus rides are, exploring the spatial & temporal variability of bus use in Beijing using smart card data & explainable machine learning. 🧵👇 #Transit #UrbanMobility
🔓https://doi.org/10.1016/j.jtrangeo.2025.104126
1/ 🚍 We look at how predictable bus rides are, exploring the spatial & temporal variability of bus use in Beijing using smart card data & explainable machine learning. 🧵👇 #Transit #UrbanMobility
🔓https://doi.org/10.1016/j.jtrangeo.2025.104126
1 / 2
Comments
How predictable are transit trips?
What factors influence this predictability?
This study reveals how built environments & travel habits shape bus use patterns. 🌍🚌
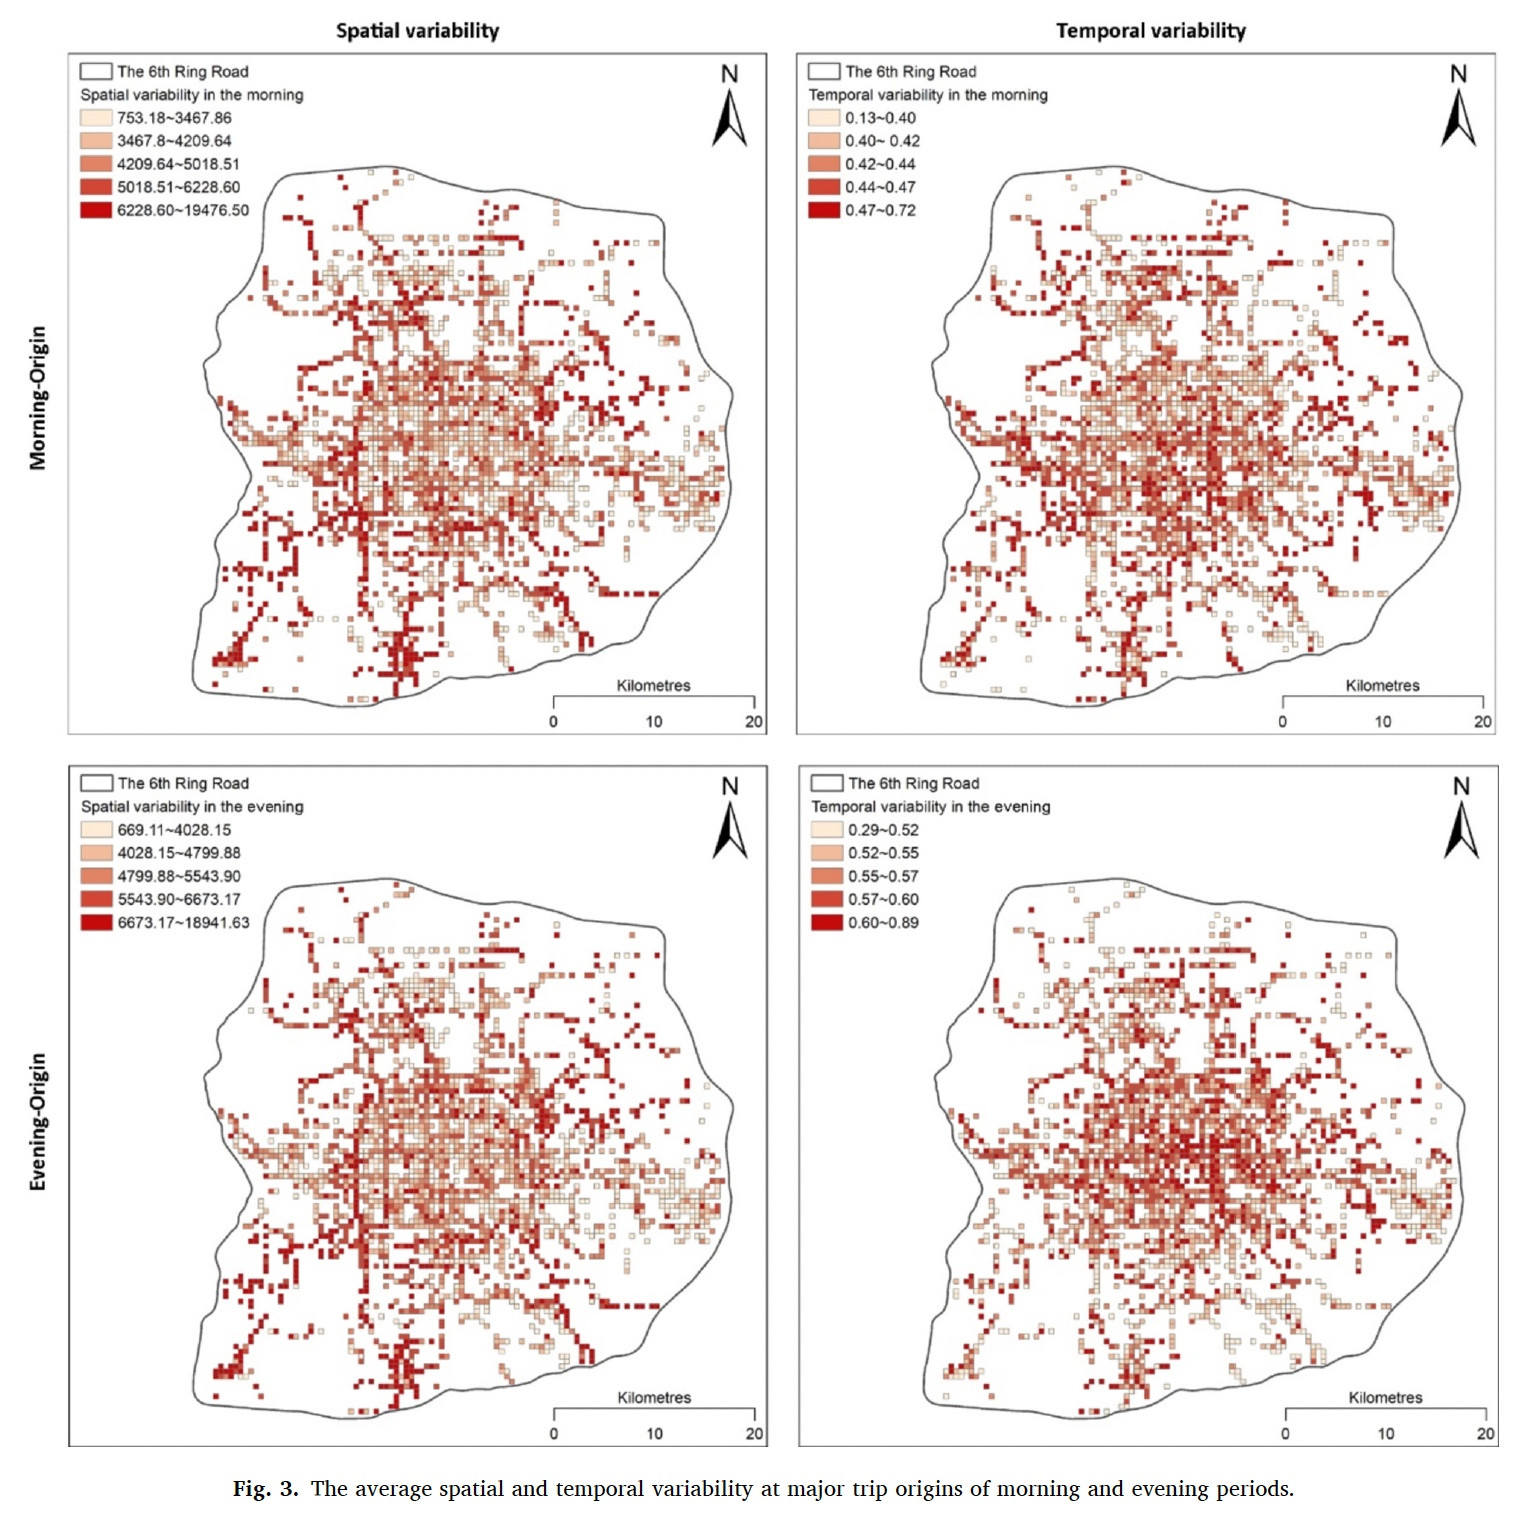
1️⃣ What drives spatial & temporal variability?
2️⃣ Are there tipping points where behavior shifts? 🔎
Trips farther from urban centers (>10 km) show greater spatial variability.
Dense areas & bus route availability reduce unpredictability.
Both too few and too many roads can increase variability. #PublicTransport
Beyond ~10 routes, adding bus routes has diminishing returns.
Long trips (>0.5 hrs) bring more temporal unpredictability.
Understanding these thresholds can inform smarter transit planning. 📊🚦
Prioritise areas >10 km from city centers with better bus routes.
Densify road networks where sparse, but avoid oversaturation.
Tailored solutions for varied rider needs improve service resilience. #SmartCities