score 1.27PPM in their first five games, compared to an 'average' seasonal average of 0.94PPM before hand. Again, to get a closer look, we divide these into the same five categories.
Comments
Log in with your Bluesky account to leave a comment
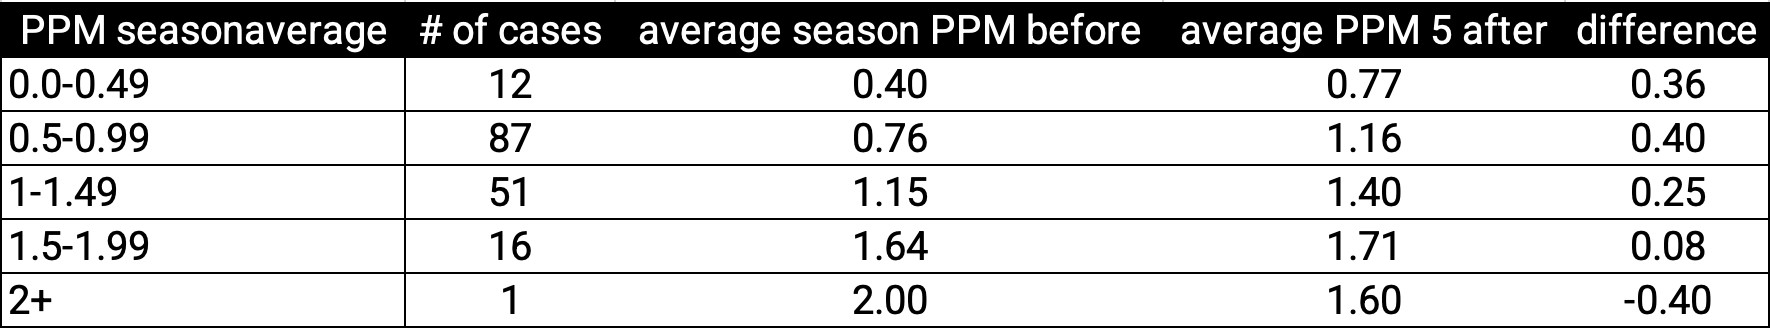
To make sure that we have a big enough sample for the seasonal PPM, we have only taken into account managers hired after GW10. Here, the numbers in the categories from 0.0-1.49 seem quite significant, but once again we have to compare them to our population:
Here actually, for a PPM season average of under 0.5, managers who stayed actually did a slightly better job in the next five matches then recently hired once. Again, this could be for a number of reasons hard to put into numbers, but it might have to do with the fact that these teams generally ...
... are just very, very bad. Like Leicester City this season, who have barely improved after v. Nistelrooy's arrival!
It is interesting to note however that in the category 0.5-1.5, newly hired managers actually seem to have had a great advantage over managers who stayed in their seats.
Now, to determine if any of these findings actually have any statistical significance and we are sure that these differences are not due to 'luck' or 'chance', we have to do some (not so interesting, but very important) statistical analysis. If you are not interested in this, just skip straight ...
through to the big red arrows in the end with the word "CONCLUSION". You'll find it!
If you're still reading however, let's get into it. We will be performing a series of one-sided hypothesis tests with a z/t-test statistic and a significance level of 0.05. We assume normality because our sample ..
First, let's look at the general results. In part 1, we got:
A sample of 192 with an average of 0.73 before and 1.27 after. The differences over these 192 cases had a st. dev. of 0.6499. In this case, we actually use a t-test, and get a t-statistic of approx.

Comments
It is interesting to note however that in the category 0.5-1.5, newly hired managers actually seem to have had a great advantage over managers who stayed in their seats.
If you're still reading however, let's get into it. We will be performing a series of one-sided hypothesis tests with a z/t-test statistic and a significance level of 0.05. We assume normality because our sample ..
First, let's look at the general results. In part 1, we got:
A sample of 192 with an average of 0.73 before and 1.27 after. The differences over these 192 cases had a st. dev. of 0.6499. In this case, we actually use a t-test, and get a t-statistic of approx.