
To make sure that we have a big enough sample for the seasonal PPM, we have only taken into account managers hired after GW10. Here, the numbers in the categories from 0.0-1.49 seem quite significant, but once again we have to compare them to our population:
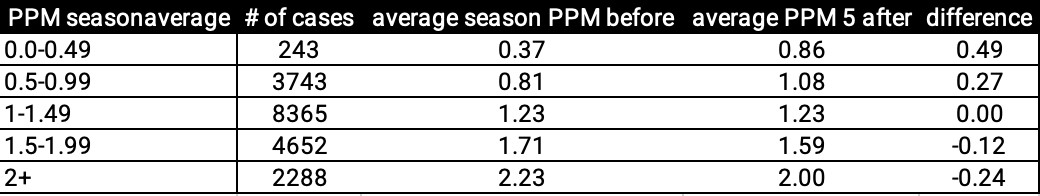
Comments
It is interesting to note however that in the category 0.5-1.5, newly hired managers actually seem to have had a great advantage over managers who stayed in their seats.
If you're still reading however, let's get into it. We will be performing a series of one-sided hypothesis tests with a z/t-test statistic and a significance level of 0.05. We assume normality because our sample ..
First, let's look at the general results. In part 1, we got:
A sample of 192 with an average of 0.73 before and 1.27 after. The differences over these 192 cases had a st. dev. of 0.6499. In this case, we actually use a t-test, and get a t-statistic of approx.
In part 2, we got:
A sample of 167 with an average of 0.94 before and 1.27 after. The differences over these 167 cases had a st. dev. of .6298, which gives us a t-statistic of approx. 6.77, which again is very strong evidence ...