In an inflationary environment, property taxes have a unique feature/bug. They require policymakers to constantly increase rates to maintain the same level and quality of services as last year.
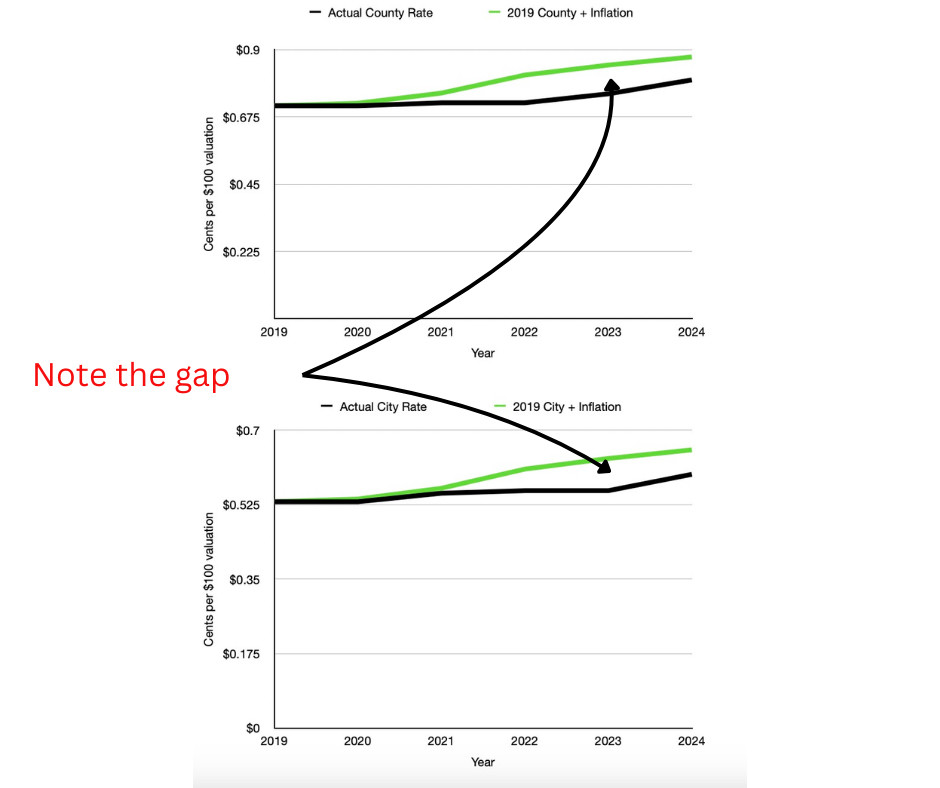
The graphs pictured below show that we are significantly below what inflation would have demanded. The black line is the actual property tax rate for that year, the green line is what would have happened if we took the prior year's rate and added the rate of inflation.
I think the data shows the explosive growth in population Durham County has experienced shielded residents from even more tax increases or significant cuts in county and city services.

Comments
Tax rates -> https://www.dconc.gov/county-departments/departments-f-z/tax-administration/tax-rates
Inflation -> https://www.minneapolisfed.org/about-us/monetary-policy/inflation-calculator/consumer-price-index-1913-
Check my math -> https://docs.google.com/spreadsheets/d/1HtcyUFpoWOJ5vZpVqx38Z97HRe-TwJ6r/edit?usp=share_link&ouid=110927874883457603539&rtpof=true&sd=true