
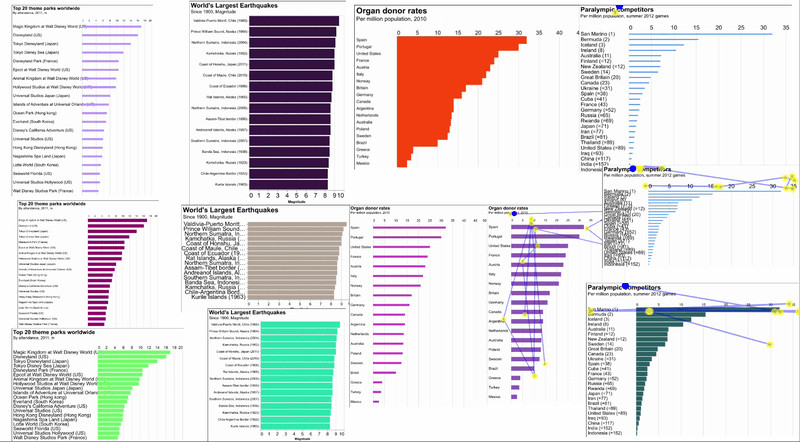
1/ How people read charts when they have a specific task in mind? Their gaze isn’t random!
Our #CHI2025 paper introduces Chartist, the first model designed to simulate these task-driven eye movements. 📄 https://arxiv.org/abs/2502.03575
Our #CHI2025 paper introduces Chartist, the first model designed to simulate these task-driven eye movements. 📄 https://arxiv.org/abs/2502.03575
Comments
🧐 Want to find a specific value?
🔍 Need to filter relevant data points?
📈 Looking for extreme values?
Chartist predicts human-like eye movement, simulating how people move their gaze to address these tasks.
Chartist uses a hierarchical gaze control model with:
A cognitive controller (powered by LLMs) to reason about the task-solving process
An oculomotor controller (trained via reinforcement learning) to simulate detailed gaze movements
Chartist integrates task-driven cognitive control and oculomotor control, making it better at simulating how humans actually read charts. Best part? Chartist doesn’t need human eye-tracking data for training!
🚀Visualization design evaluation → Identify design issues before user testing
🚀Visualization design optimization → Automate feedback on data visualizations
🚀Explainability in chart question answering → Understand how visualizations influence perception
🔗 https://chart-reading.github.io
👨💻 Danqing Shi @danqingshi.bsky.social , Yao Wang , Yunpeng Bai, Andreas Bulling, and Antti Oulasvirta @oulasvirta.bsky.social