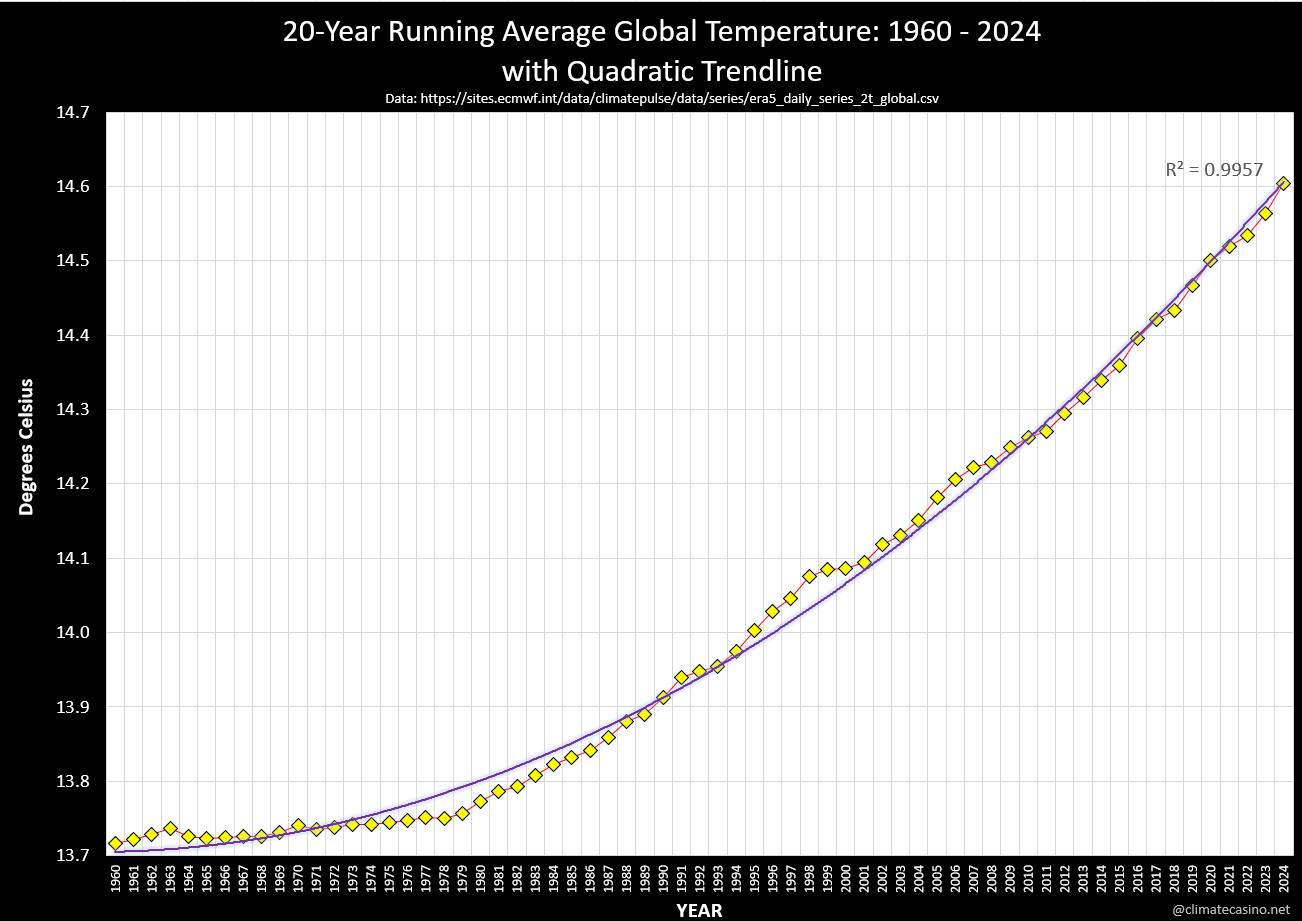
I just realized I have a small error in the previous chart -- the value of R² was a leftover from a previous graphic. Quadratic is actually even a better fit, if you can believe it!
Here is the corrected graphic.
Here is the corrected graphic.

Comments
Quadratic or kubic growth is worse enough.
This incorrect interpretation is used by some on social media who peddle NTHE disinformation.
We are f&%ked, but not exponentially f&%ked.
It’s as if our climate is picking up speed and now on a steady accelerating rail (towards a cliff)…