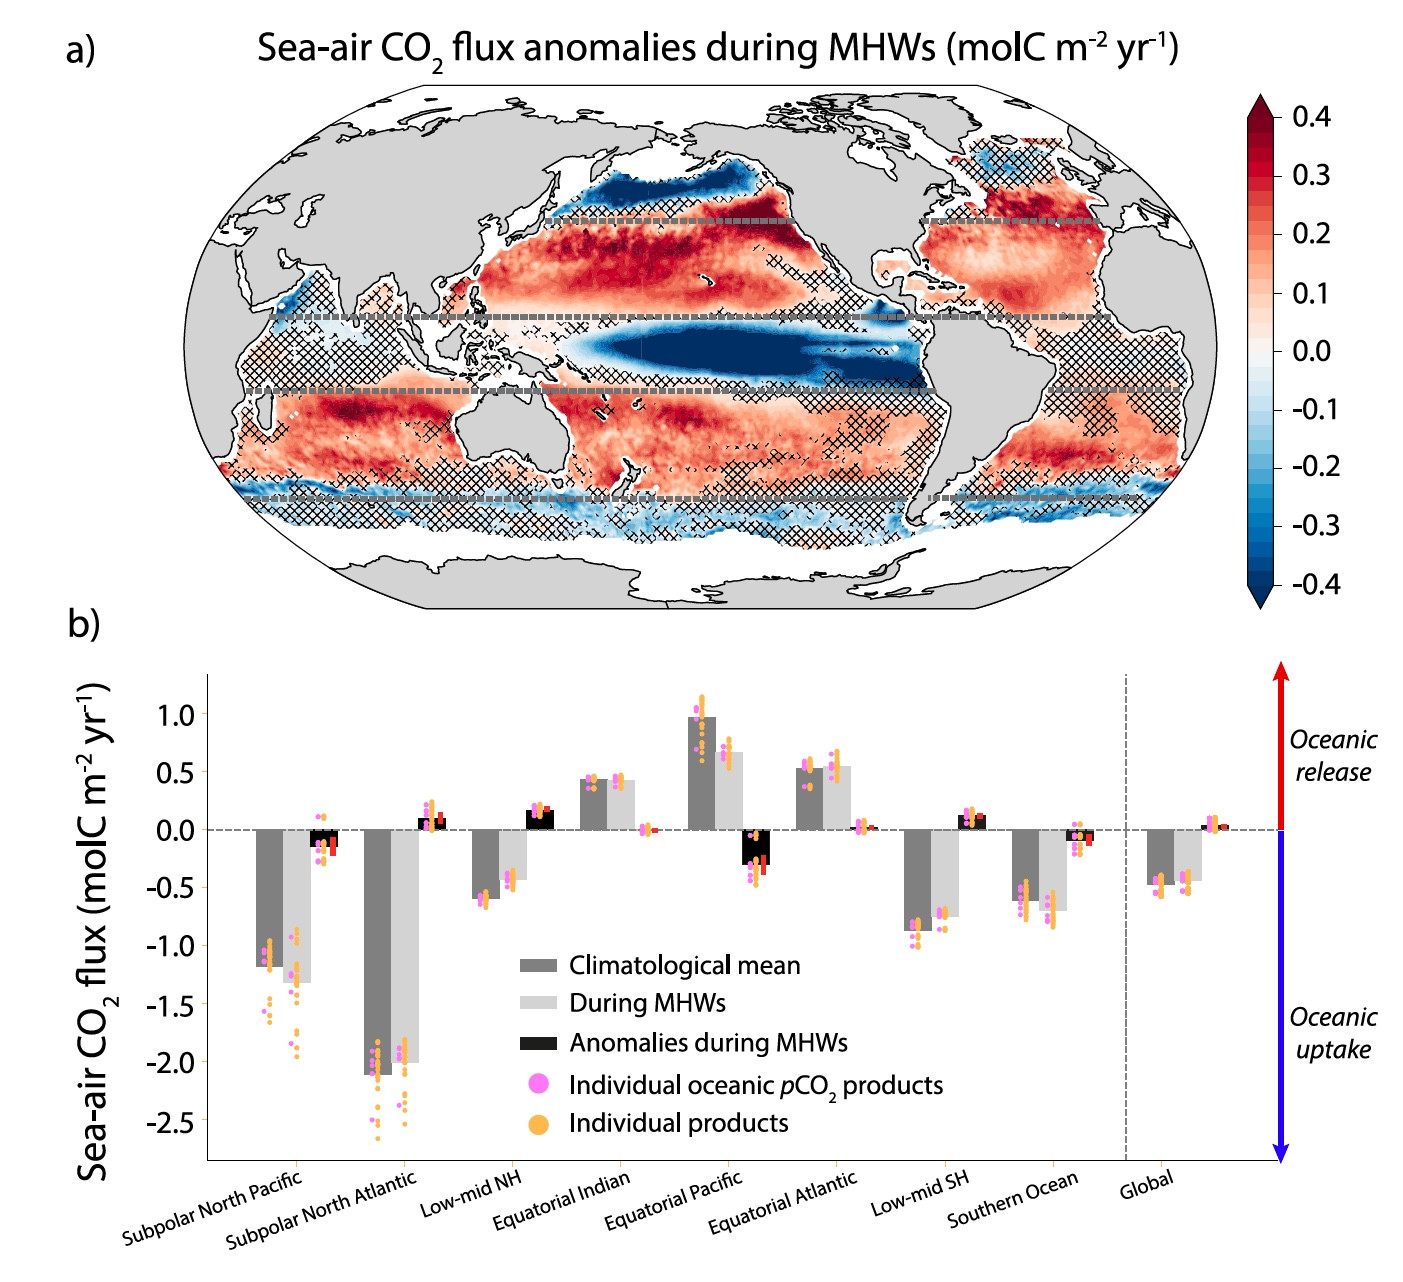
Marine heatwaves (MHWs) don’t just harm ecosystems—they also alter the ocean’s carbon cycle! Our new analysis of 30 global datasets shows ocean CO₂ uptake drops by 8% during MHWs, with regional anomalies reaching up to 30%. 🌊
Comments
Log in with your Bluesky account to leave a comment
Interesting that - on a global average - the ocean carbon sink weakens under MHWs. In contrast, the annual mean CO₂ uptake tends to be anomalously strong when the global mean SST is high (see top left panel). How should we explain this apparent contradiction?
The uncertainty of the fit appears to be way too small in that figure given the enormous spread of the data points. Of it is a 1 sigma, 68% of the points should be inside the uncertainty range, no? Is this really a robust linear fit? R2 should be really small and p really high, no?
Thanks, Jens. I used R’s ggplot package to draw the CI and will double check this. More importantly, all uncertainty estimates reported in our study are based on the ensemble spread of 4 observation-based fCO2 products. This approach leads to broadly consistent estimates as you derived below.
Thanks Jens. The uncertainties from the products are not a concern to me. Please excuse me if I did not frame it right. What I was concerned is the first sentences in the abstract:
"In 2023, sea-surface temperatures (SST) reached record highs. Based on historical responses, this SST anomaly would suggest an increased oceanic CO2 uptake (-0.11±0.03 PgC yr-1)."
If you use prediction intervals to quantify the uncertainty of an expected value on y based on x, the uncertainty is around the expected value is four-fold larger. Given that the r2 is small and p is large, I am not even sure if it is okay to speak of an expected value for the ocean carbon sink.
I took the liberty to read the data from the graph (without the uncertainties). The r2 is 0.08, the p-value is 0.11 meaning that the trend is not significant. I then used the emergent constraint approach & the observed anomaly in 2023, the expected anomaly of the carbon sink is -0.05±0.13 Pg C yr-1
Thus, the value of the ocean carbon sink in 2023 is within the 2-sigma range and not significantly different from what is expected. The uncertainty is twice as high as in the graph. ?
Maybe accounting for the uncertainties of each data point changes something, but at the moment I cannot imagine how that would make so large differences. And always, my calculations might be wrong ;)
Here is the associated figure with a 1-sigma projection uncertainty. As mentioned earlier, the carbon sink anomaly is out of the 1-sigma range but within the 2-sigma range. Taking in the uncertainty of the 2023 carbon sink anomaly, it overlaps with the 1-sigma range.
I believe to predict an individual value (anomaly in 2023 ocean carbon sink) and not the mean value many potential realizations of the sink in 2023, the prediction interval is correct and the confidence interval substantially underestimates the uncertainty.
Thanks to both of you for your recommendations. I will test this approach, but also need to take the consistency of the uncertainty determination across the whole study into consideration, which involves in most parts the assessment of an ensemble spread.
I would not say that the confidence interval is underestimating the uncertainty; it's communicating a different quantity (uncertainty in the conditional mean). But I agree that a prediction interval would be valuable here, and that they ought to be used more often.
Just for clarification, the confidence interval only communicates the uncertainty of the contribution of the variable on the x-axis to the spread of the variable of the y-axis, right? Given that r2 is around ~0.1, x only explains around 10% of the spread of y. Is that right?
Exactly, I believe that is what happened (see thread). To estimate where year 2023 wiukd have been expected to be based in a given temperature anomaly, the prediction interval should have been used, no? But maybe I misunderstand the statistics here
Tropics show less CO₂ outgassing due to lower dissolved inorganic carbon, while mid-latitudes weaken CO₂ uptake due to termally induced rise in oceanic pCO₂. Marine heatwaves can trigger significant CO₂ flux anomalies, especially in the central equatorial Pacific.
Yet, unlike land heatwaves—where soil moisture loss, heat stress, & wildfires drive extreme carbon fluxes—MHWs aren’t always linked to the most severe CO₂ flux anomalies.
2023–2024 saw record-high ocean temperatures in almost all ocean basins. What does this mean for carbon uptake? Our findings suggest extreme sea surface temperatures from these years likely reduced ocean CO₂ uptake despite El Nino.

Comments
https://www.datacamp.com/blog/confidence-intervals-vs-prediction-intervals?dc_referrer=https%3A%2F%2Fwww.google.com%2F
https://bsky.app/profile/jens-d-mueller.bsky.social/post/3ld4czgk5c22n