
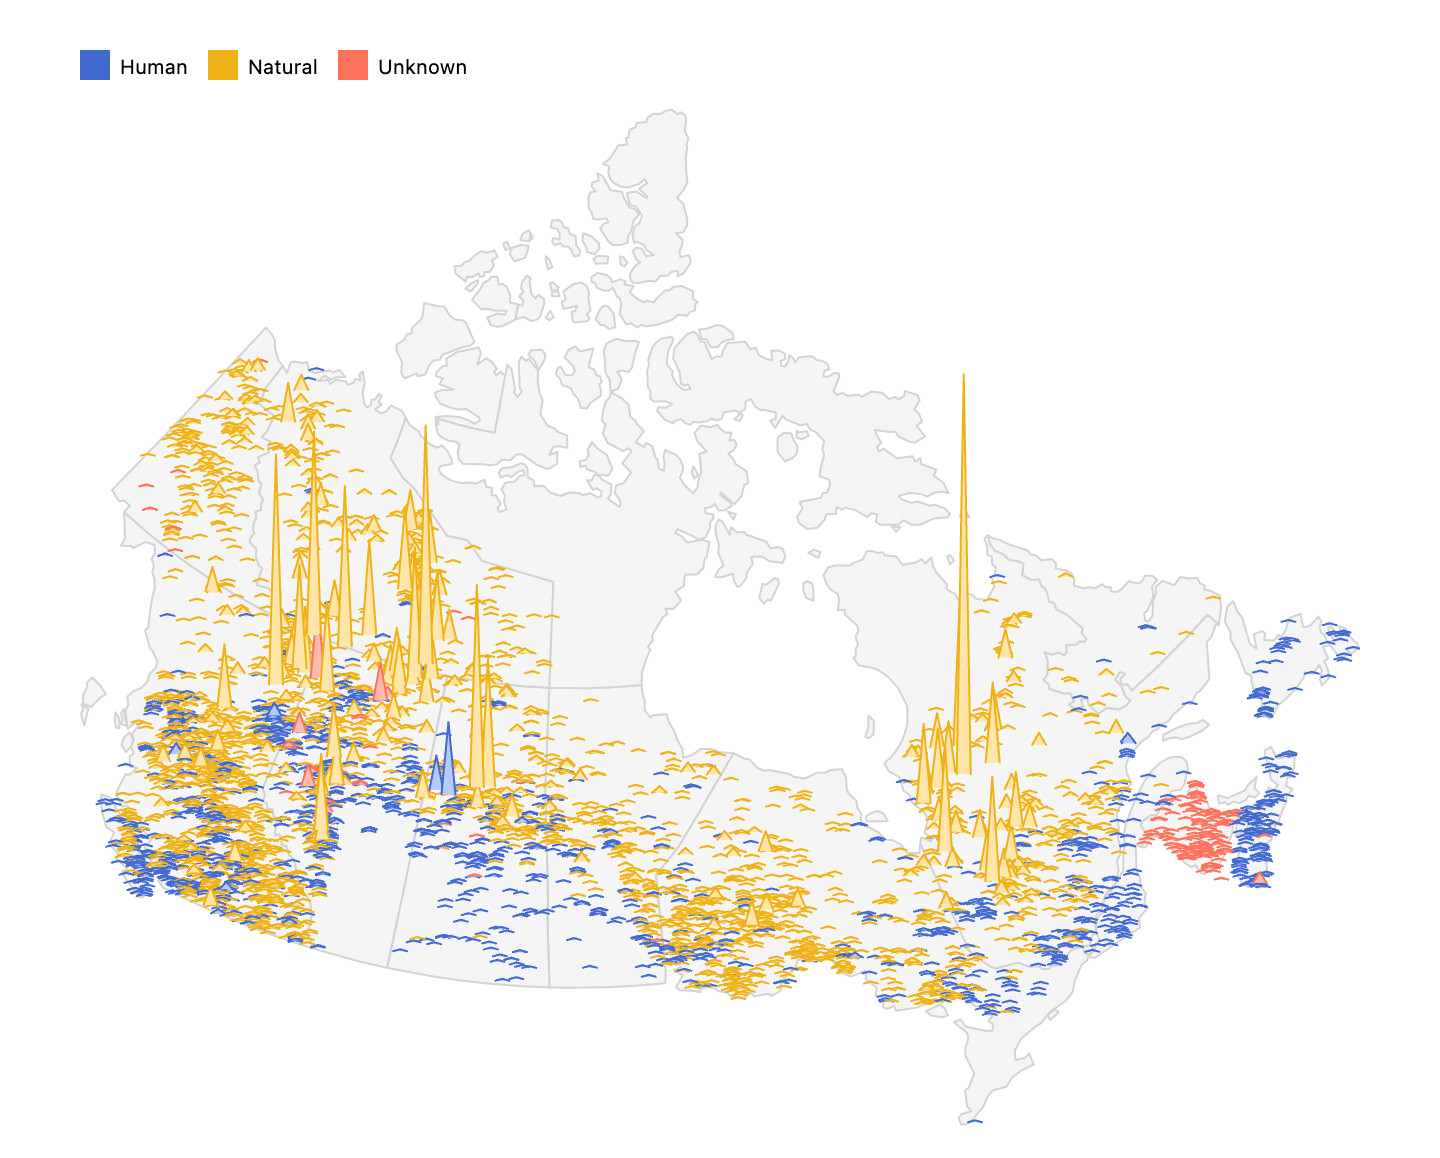
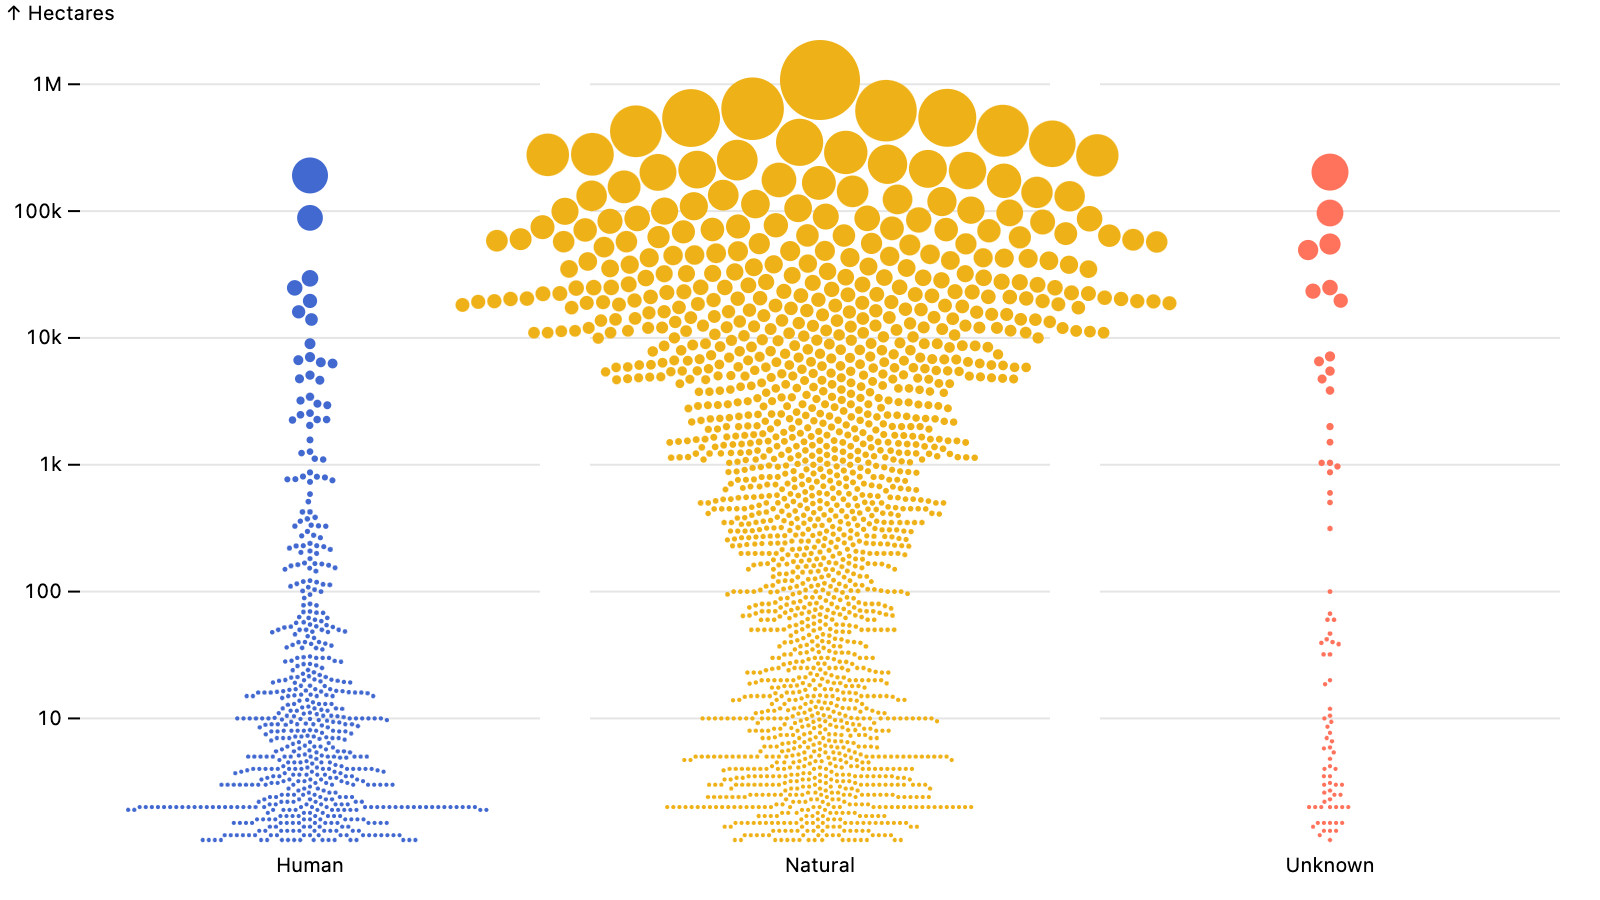
Learn how to create stunning charts 📈 and maps 🌍 in this new lesson on Code Like a Journalist! We'll code #dataviz together using data from the 2023 Canadian wildfires.
I rewrote it a few times, so I’d love for you to check it out. 😅
Link in the comments! 👇
I rewrote it a few times, so I’d love for you to check it out. 😅
Link in the comments! 👇
1 / 2
Comments