
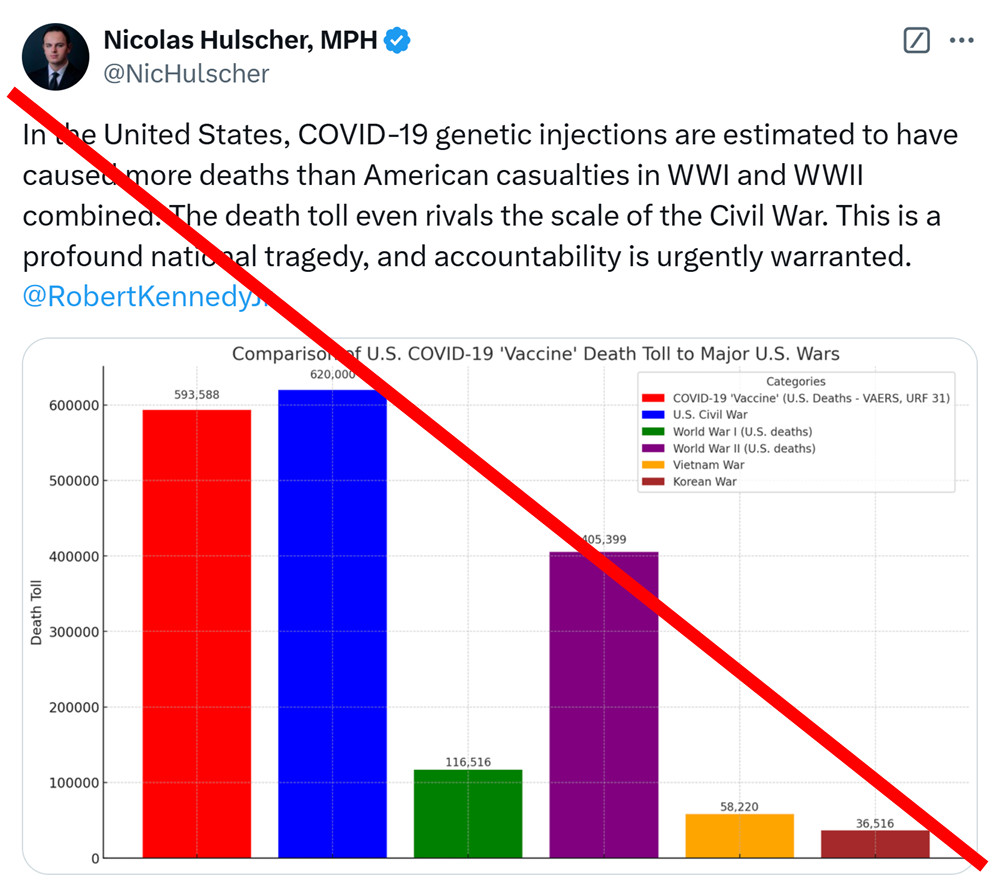
The generation of disinformation is easy. You make a graph, type something, and you are done.
Showing how wrong it is takes more time. This is an easy example. The graph is made up, but for some, it will not be clear why this is wrong and is dangerous disinformation.
1/7
Showing how wrong it is takes more time. This is an easy example. The graph is made up, but for some, it will not be clear why this is wrong and is dangerous disinformation.
1/7
Comments
2/7
https://metro.co.uk/2020/12/18/covid-vaccine-volunteer-struck-by-lightning-after-moderna-injection-13774498/
Meaning: there is a background rate of deaths. In the US: 3M per year, which is ~58,000/week
3/7
These are false numbers. But it gets worse.
4/7
The excuse is "underreporting". Is this true? Yes., there is underreporting. If you have a painful arm, a sensitive injection site, etc
5/7
6/7
No, please do not share!
7/7
Medical professionals are “required by law” to report specific adverse events. Death was one of the events listed for the Covid vaccines and there were no temporal proximity limits.
Millions of Americans die every year. The odds are most of them had a Covid vaccine.
It takes at least one order of magnitude more effort to debunk misinformation than it does to spread it.