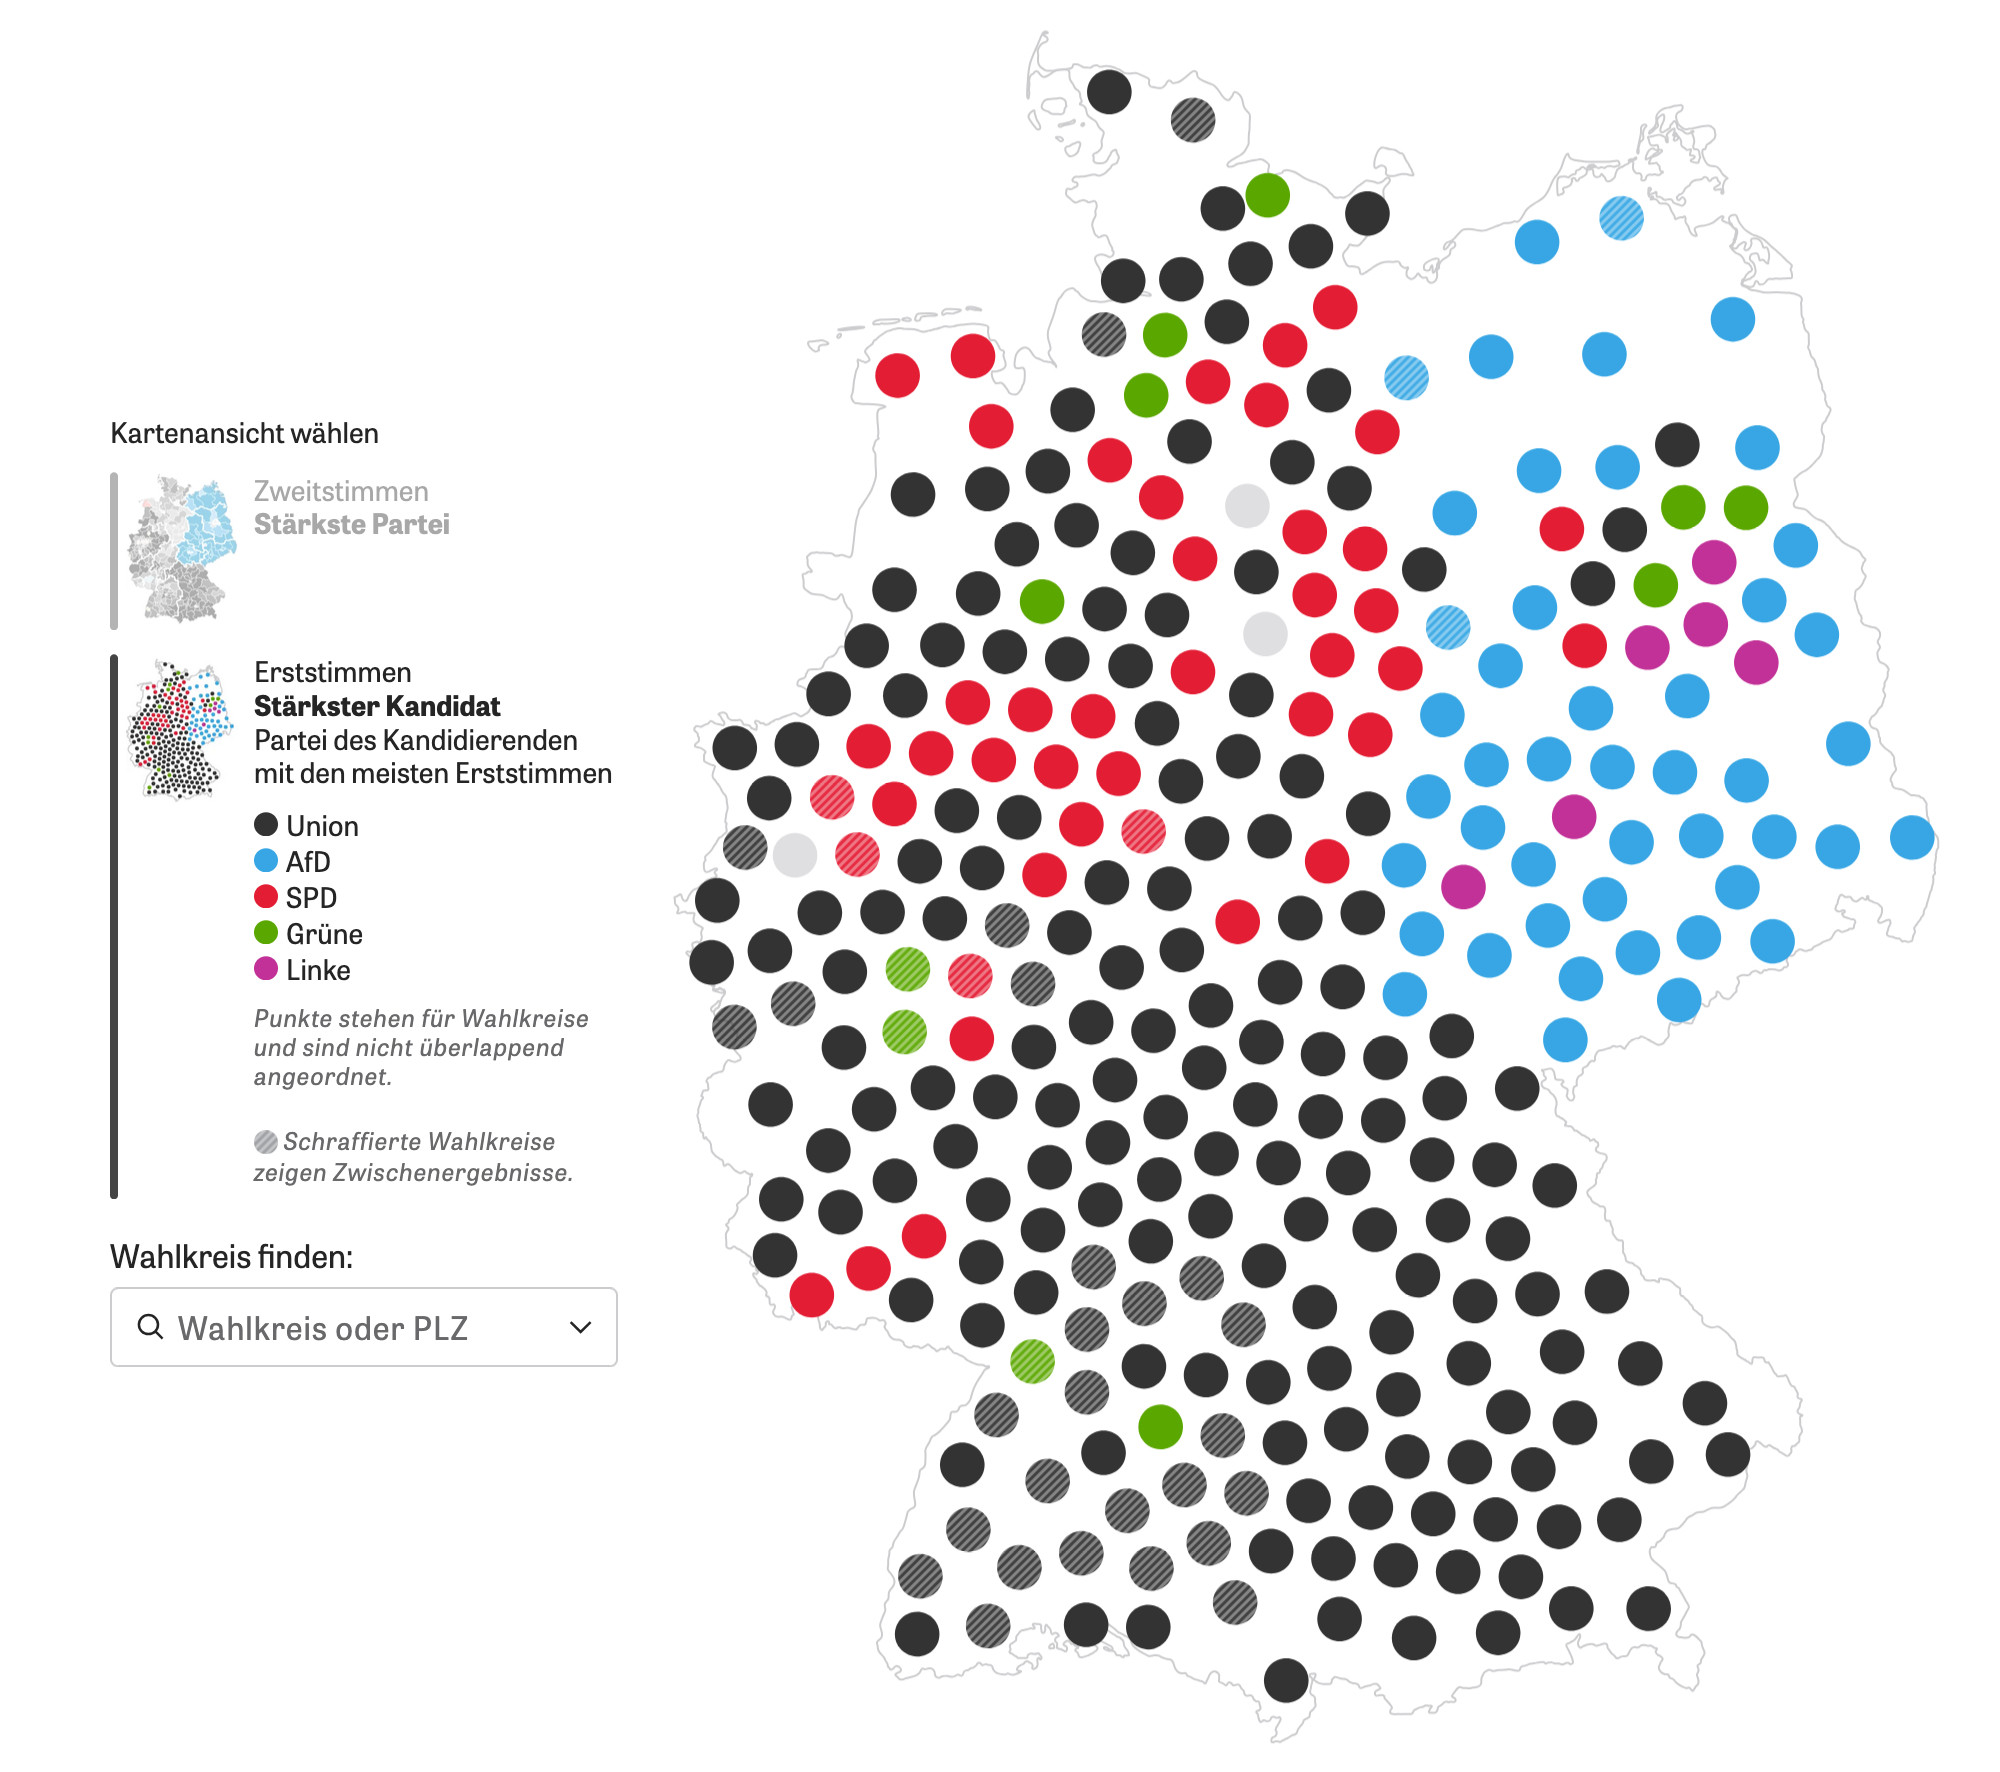
For the German election we wanted to use a cartogram of German election districts but didn't find anything good, so we created our own. Here's a little nerd thread how the final algorithm worked 🤓 🧵 #gis #cartogram #election #datavis #cartography
Comments
Log in with your Bluesky account to leave a comment
I do not like that you fixed the outer districts because it psychologically emboldens the people in the empty countryside and that function we have already with conventional maps. It’s okay if the shape is distorted, it should be, that is a feature, not a bug!
If we really wanted to keep it one could fill the map with lots of dots representing a Wahlbezirk or at least the Briefwahlbezirke each. That would give a psychologically more truthfully effect to voters. It is not offensive to tell small groups that they are small and that land does not vote.
This is great! Is there any reason you can't do this as well for the Zweitstimmen map as well (with the dots for for each district vote shares shaded in the same way as the geographical map)?
As input for the cartogram we use a pre-projected TopoJSON basemap of election districts with baked-in centroids (inner points). We used Mapshaper to generate the file.
Before running the network layout simulation on this, we marked all the outer districts as fixed. This allows the final layout to stay "in shape" of the country as a whole, which is important for readers to recognize their country.
We used the TopoJSON arcs to automatically find these districts.
Some of these fixed districts turned out to be too close to each other, so we defined a few exceptions for border districts we want to be free, and also a few custom positions that prevent the nodes to "leave" the country.
To compute the final layout we use a force simulation with 3 forces: one of them keeps neighboring districts together while another pushes districts away from each other if they are too close. Coloring the nodes helped to identify problems during the process.
Great work.
I correlated the social determinants with the results of the elections for Thüringen. The higher the results for the AfD, the lower men's income is (in relation). This is similar with CDU voters.
As a layman in geovisualisation i was thinking about doing something similar as a hobby project, but projecting onto a rectangular grid. Instead of forces I'd try to do some combinatorial optimization with a "distance from geographical position" term, very similarly to this approach. Inspiration:

Comments
Thanks so much for sharing. Very clever approach.
We used the TopoJSON arcs to automatically find these districts.
I correlated the social determinants with the results of the elections for Thüringen. The higher the results for the AfD, the lower men's income is (in relation). This is similar with CDU voters.
Auch nicht schlecht: die Realität ist diverser.