
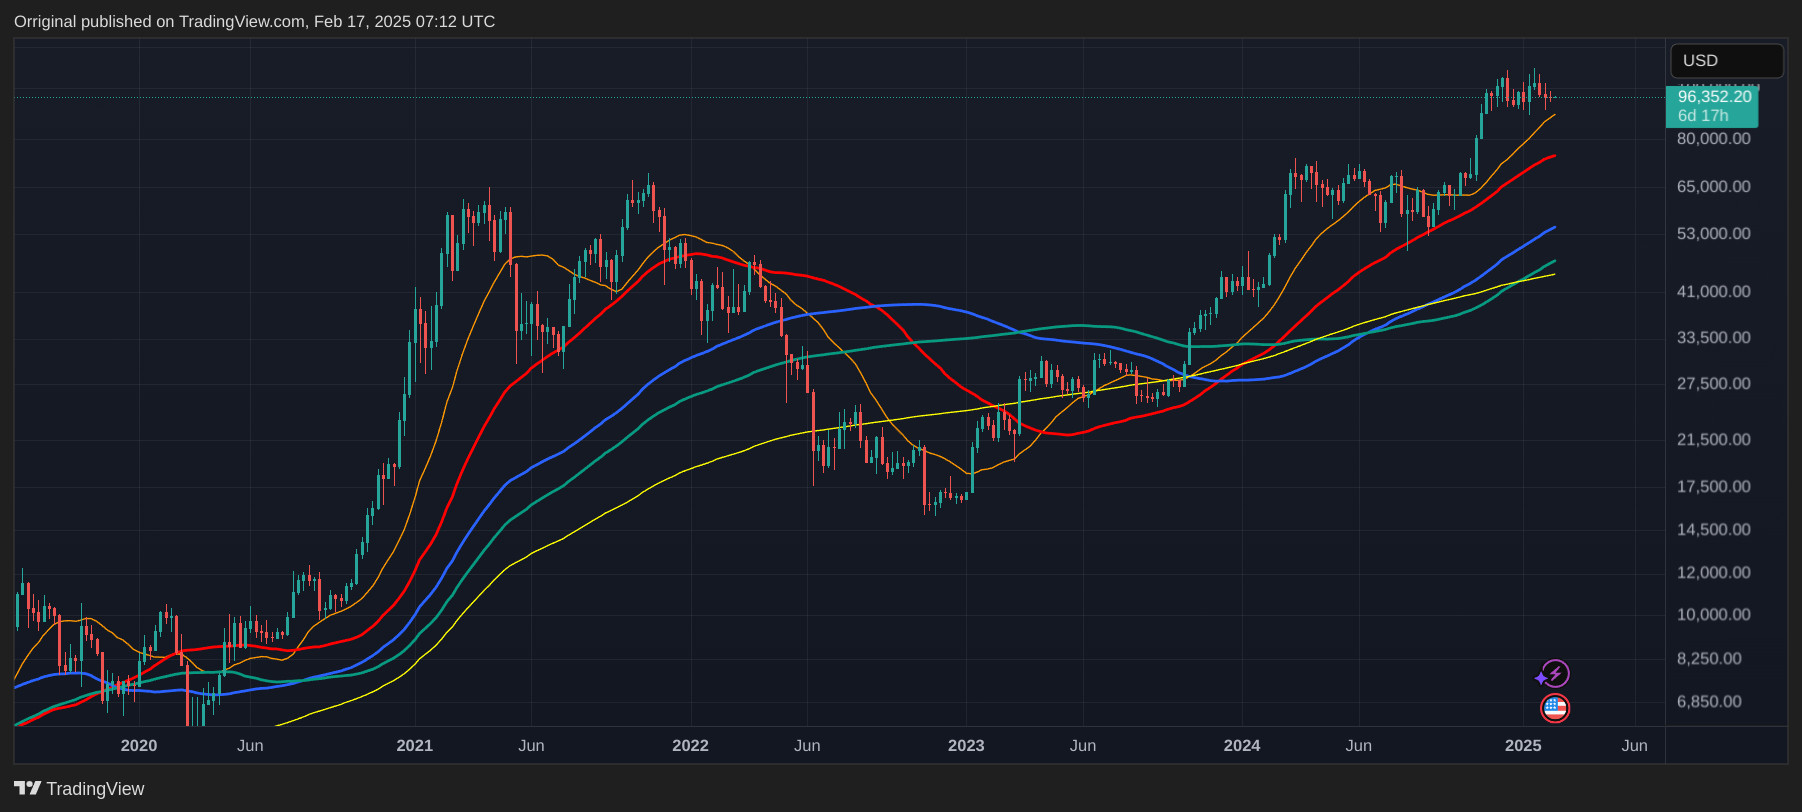
Bitcoin and the Weekly Simple Moving Averages ( SMA )
Chart goes back to 2019 and shows 5 SMA
21 - Orange
50 - Red
100 - Blue
128 - Green
200 - Yellow
Number represents chart time Frame.
i.e. 21 = 21 days on daily, 21 hours of hourly
Note how PA uses 50SMA as support - Current 50SMa @ 74700 usdt
Chart goes back to 2019 and shows 5 SMA
21 - Orange
50 - Red
100 - Blue
128 - Green
200 - Yellow
Number represents chart time Frame.
i.e. 21 = 21 days on daily, 21 hours of hourly
Note how PA uses 50SMA as support - Current 50SMa @ 74700 usdt
Comments