ThreadSky
About ThreadSky
Log In
lorehayek.at
•
10 days ago
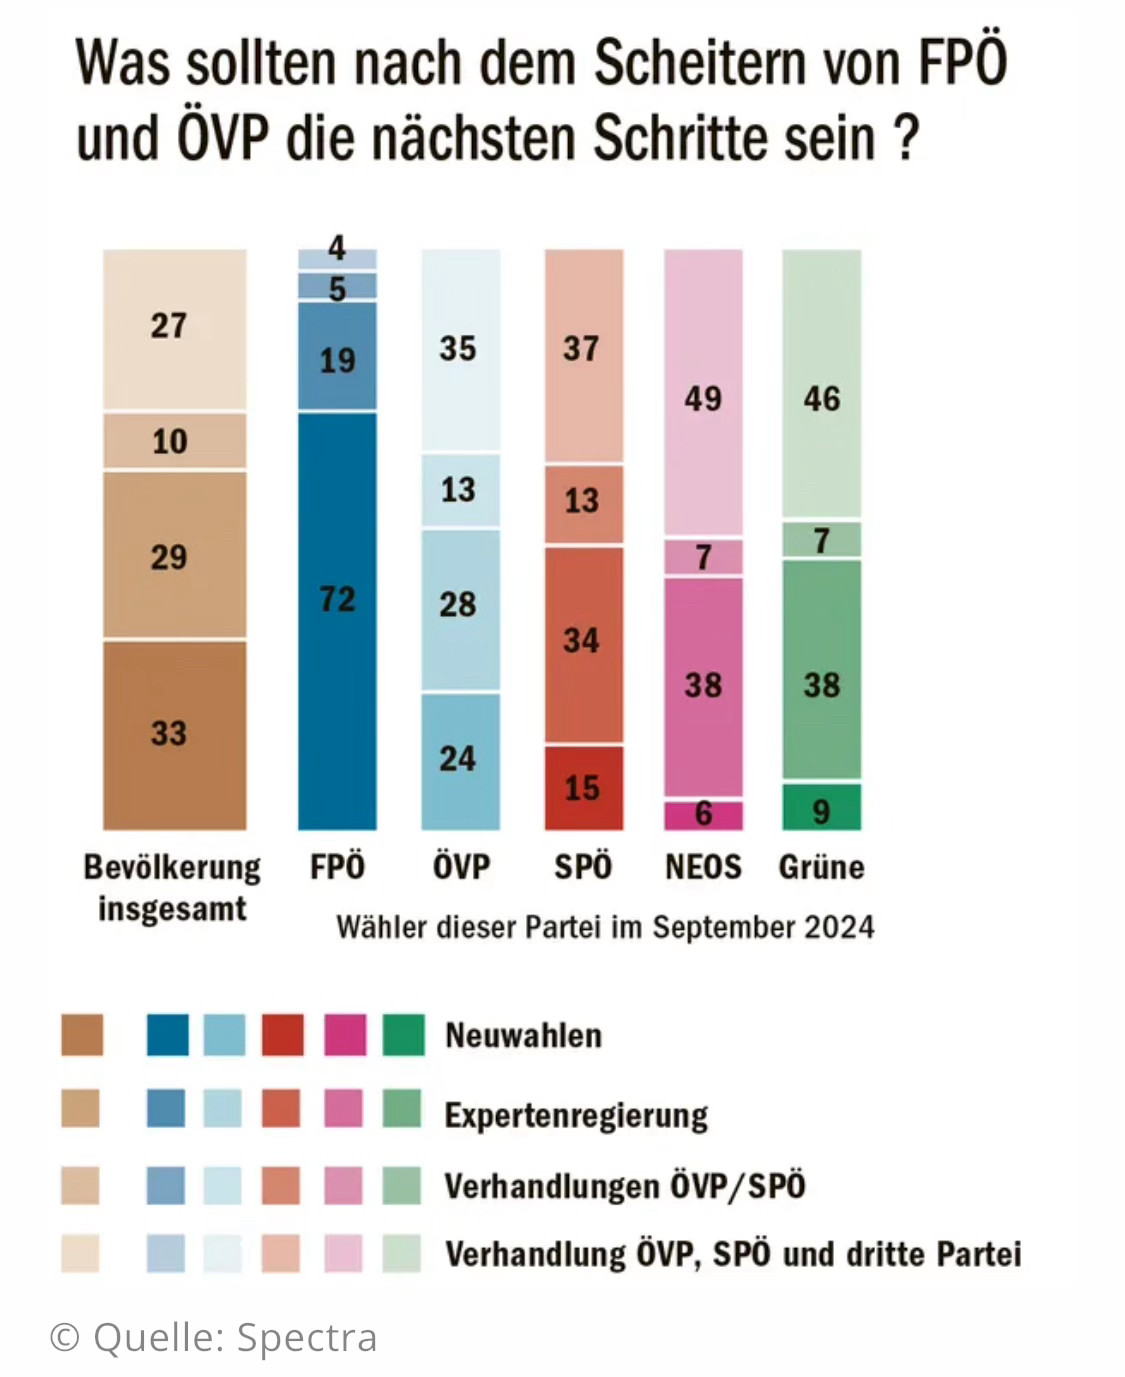
Aufgabe: Gestalten Sie diese Grafik so unlesbar wie möglich.
(Quelle: TT)
Comments
Log in
with your Bluesky account to leave a comment
[–]
heinzjanine.bsky.social
•
10 days ago
Immerhin kein Tortendiagramm
2
reply
[–]
juliapuehringer.bsky.social
•
10 days ago
Ist das nicht zum Wandfarbe aussuchen oder wie?
5
1
reply
[–]
s-quadr.at
•
10 days ago
Die Nägel würde ich mir in den Farben jedenfalls nicht lackieren.
0
1
reply
[–]
juliapuehringer.bsky.social
•
10 days ago
Hey, why not.
0
1
reply
[–]
s-quadr.at
•
10 days ago
Gefallen mir halt alle nicht.
0
reply
[–]
bettercallmarkus.bsky.social
•
10 days ago
Leser der TT sind für ihre mathematisch-analyitschen Fähigkeiten bekannt. Dafür könnte man sich das Sudoko ersparen.
2
reply
[–]
jamoeberl.bsky.social
•
10 days ago
Viele Farben! 🫠
3
reply
[–]
tovabele.bsky.social
•
10 days ago
ur geil wie die reihenfolge der legende EXAKT gegen gleich zur grafik ist
2
reply
[–]
stebi.bsky.social
•
10 days ago
War daneben das Sudoku?
0
reply
[–]
mundl-sackbauer.bsky.social
•
10 days ago
Die Grafik ist gut lesbar und nachvollziehbar, weder verwirrend noch unlogisch. Einzig die Angabe, ob es sich um Äpfel, Birnen oder Prozente handelt, geht ab.
1
1
reply
[–]
ucanthandle.bsky.social
•
10 days ago
Es hilft auch nicht gerade dass die Farbschattierungen in der Legende in umgekehrter Reihenfolge vorkommen wie in der Grafik.
2
reply
[–]
bertl.bsky.social
•
10 days ago
Farbskala für qualitativ unterschiedliche Aussagen.
Ein Fall für das Lehrbuch. Als Abschreckung.
0
reply
[–]
christines1908.bsky.social
•
10 days ago
Beschäftigungstherapie!;)
2
reply
Posting Rules
Be respectful to others
No spam or self-promotion
Stay on topic
Follow Bluesky's terms of service
×
Reply
Post Reply

Comments
Ein Fall für das Lehrbuch. Als Abschreckung.