
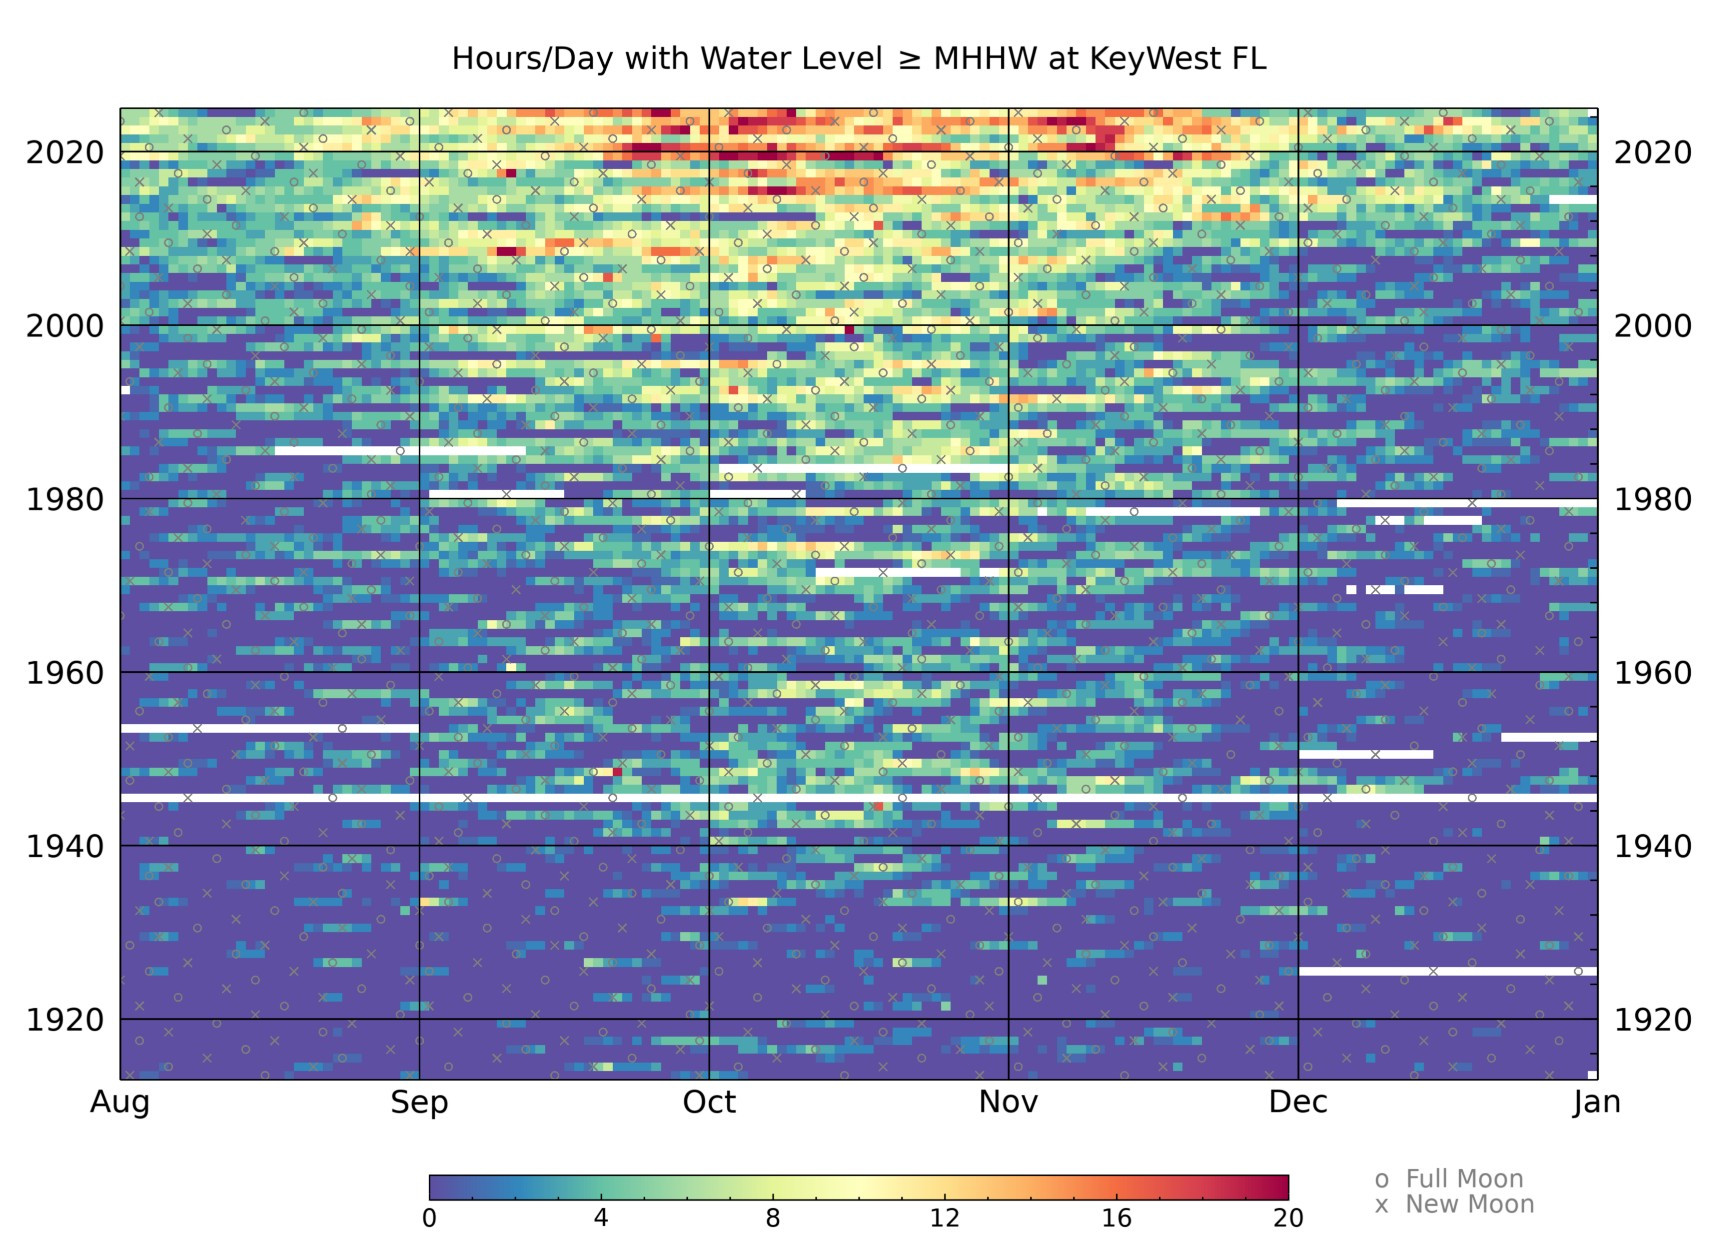
Here's a striking visualization of sea level rise that I just made for Key West FL, which has a 112-year history.
The colors indicate the number of hours each day that the water level was above the mean high tide (1983-2001 mean).
I show five months of the year, centered on "King Tide season". 🌊
The colors indicate the number of hours each day that the water level was above the mean high tide (1983-2001 mean).
I show five months of the year, centered on "King Tide season". 🌊
Comments