
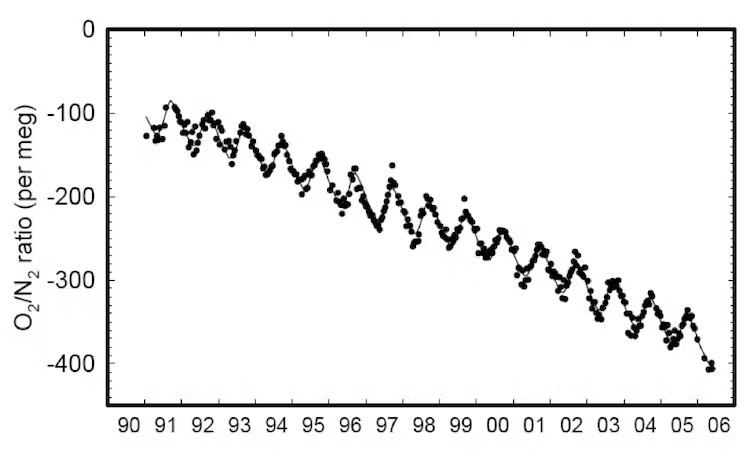
This is atmospheric oxygen to nitrogen ratio.
Oxygen is very slowly decreasing. On the time scale of the graph above, 1 tick = 1 million years, you just can't see it.
Big moves over geologic time are often volcanism, catastrophic changes in climate or major collisions with objects from space.
Oxygen is very slowly decreasing. On the time scale of the graph above, 1 tick = 1 million years, you just can't see it.
Big moves over geologic time are often volcanism, catastrophic changes in climate or major collisions with objects from space.
Comments