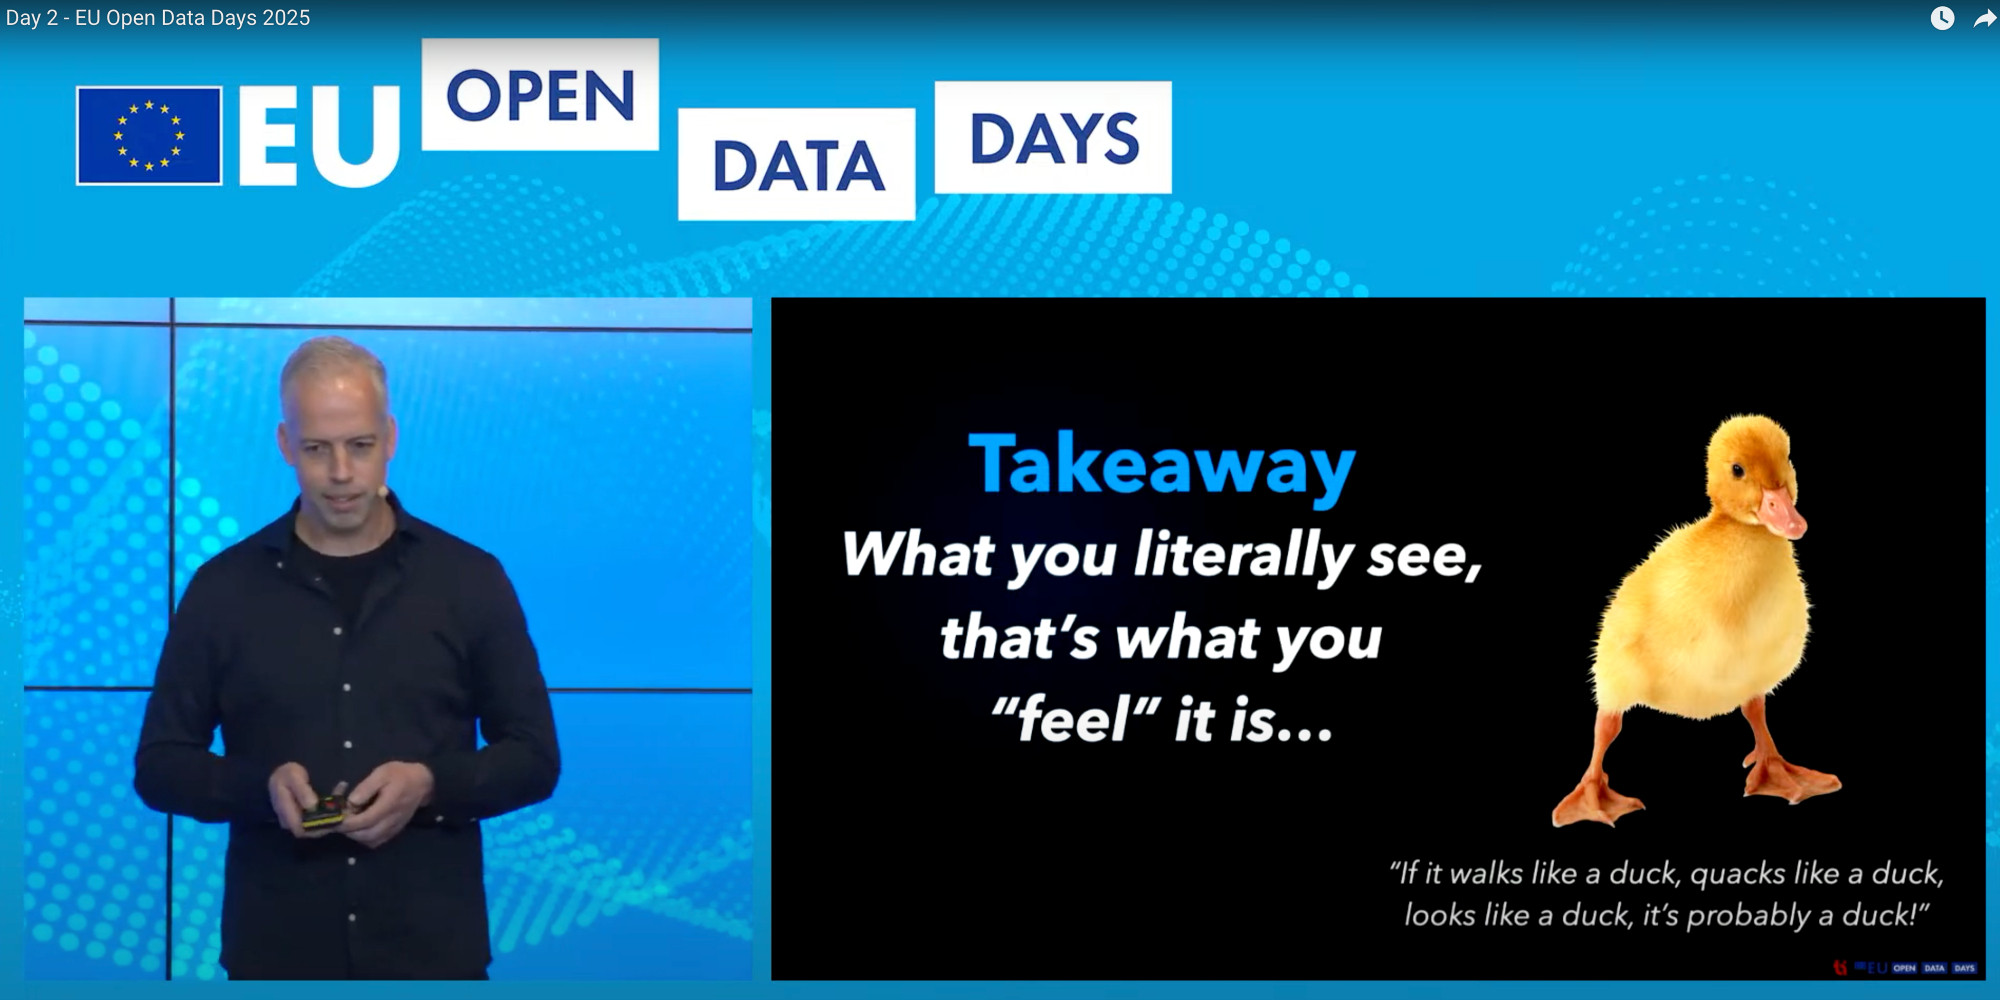
Last week, during the European Open Data Days 2025, @tulpinteractive.com revisited a crucial point in data visualization: "what you see is literally what you feel".
Comments
Log in with your Bluesky account to leave a comment
He also offers a new interpretation of timelines, showing us the age of individuals and possible encounters for each year:
🔸 Parallel Lives: https://janwillemtulp.github.io/parallel-lives/

Comments
🔸 Parallel Lives: https://janwillemtulp.github.io/parallel-lives/