
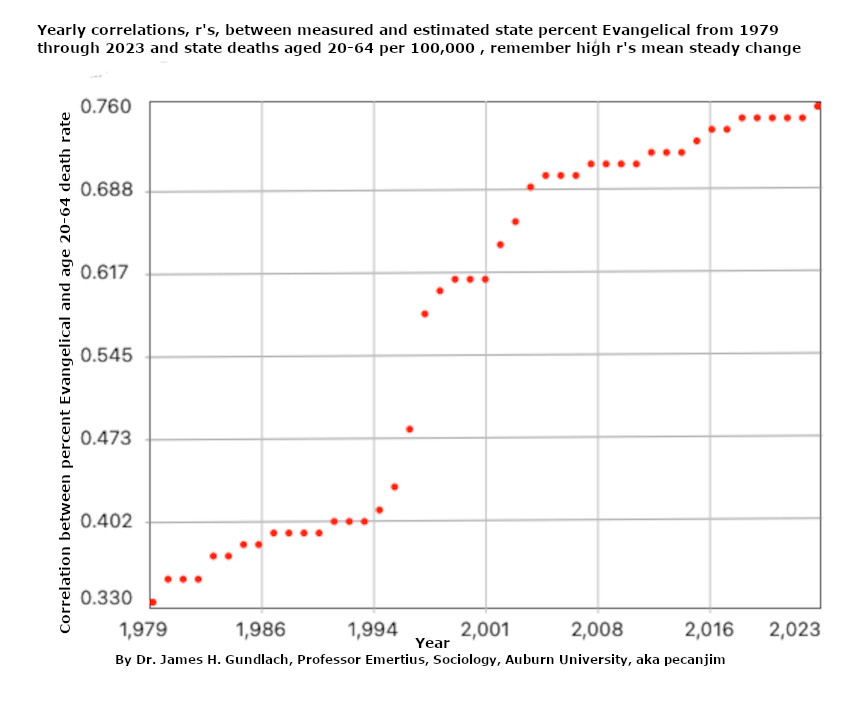
This graph shows the relationship between state percent evangelical and state age 20-64 death rates. The relationship gets stronger while the percent Evangelical , as measured here, stays close to the same. This calls for looking at this relationship by specific causes.🧪💡☠️
Comments