I have prepared an interactive version of the same graph:
https://www.ugr.es/~herrero/nievesierranevada/graficanieve/
Right now just showing the results in ONE particular valley, Lanjarón, but I'm planning to extend it to other valleys and the whole of #SierraNevada
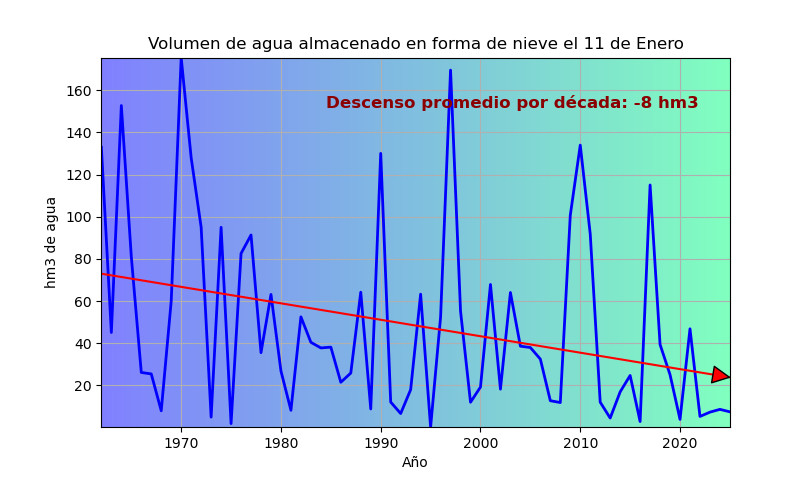
I also prepared this graph a few days ago, for the 11th of January
https://www.ugr.es/~herrero/nievesierranevada/graficanieve/
Right now just showing the results in ONE particular valley, Lanjarón, but I'm planning to extend it to other valleys and the whole of #SierraNevada
I also prepared this graph a few days ago, for the 11th of January
Comments
For switzerland till 2024 not already updated , a forum contact people made this
https://sknow.vercel.app/
with SLF open data https://measurement-data.slf.ch/study-plot/data/