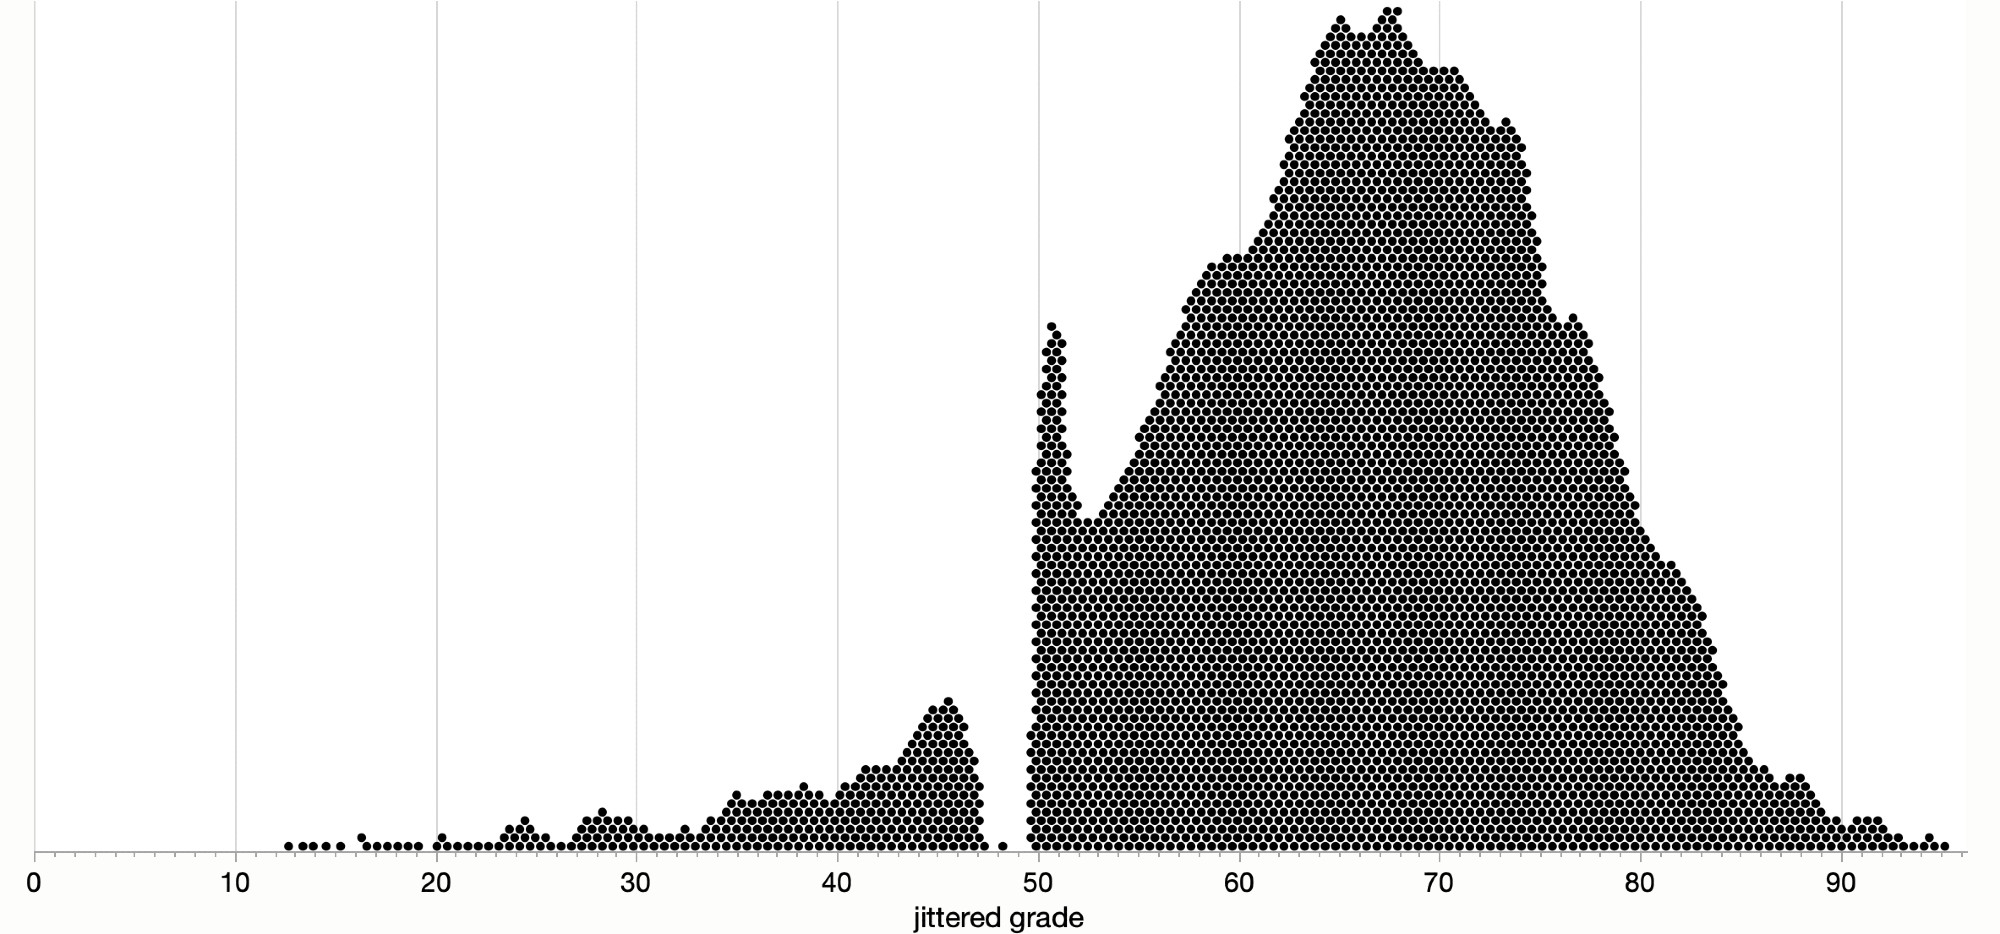
Another #dataviz from the ceiling height paper's data with an interesting pattern: density dot plot of the final course grades for two years of students, using hex grid jitter. 50 must be an important result at these Australian universities.
Comments
Log in with your Bluesky account to leave a comment

Comments