
Let's see if Bluesky has some magic ...
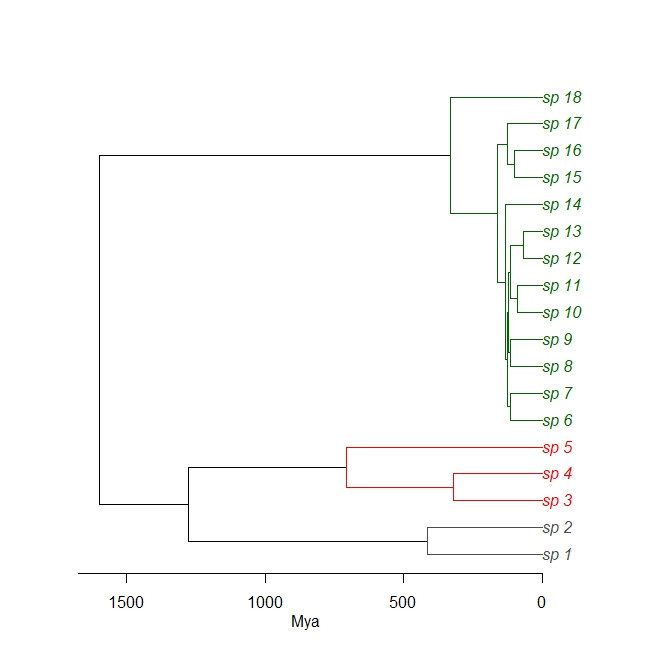
Is there a way to plot a dated phylogeny with a log-scale time axis? If possible, using R
🧪 #EvolSky #ecoevo @phylogeny.bsky.social #phylo #rstats #plantscience botany
Is there a way to plot a dated phylogeny with a log-scale time axis? If possible, using R
🧪 #EvolSky #ecoevo @phylogeny.bsky.social #phylo #rstats #plantscience botany
Comments
ggtree(t) +
scale_x_continuous(limits=c(0, 1000), breaks=c(0, 10, 100, 1000)) +
theme_tree2()
set.seed(11)
tr <- rcoal(9, br=200)
plot(tr); axisPhylo()
ggtree(tr) +
scale_x_continuous(limits=c(0, 2000), breaks=c(0, 10, 100, 1000)) + theme_tree2()
p <- ggtree(tr) + theme_tree2()
p2 <- revts(p) + scale_x_continuous(labels=abs)
set.seed(11)
tr <- rcoal(9, br=200)
plot(tr)
axisPhylo()
Let's say you used ape to import your tree:
mytree$edge.length <- log(mytree$edge.length)
layout(1:2)
set.seed(11)
tr <- rcoal(9); plot(tr)
tr$edge.length <- log(tr$edge.length)
plot(tr)
Got that using log(1+tr$edge.length)
Not quite the same but better
layout(1:2)
set.seed(10)
tr <- rcoal(9, br=200)
plot(tr)
axisPhylo()
tr$edge.length <- log(tr$edge.length)
plot(tr)
axisPhylo()
Hope you'll find out