
🧪🎅 12 Days of Tools for Science Management 🦠🎄
Day eleven: Plotting timelines in R w ggplot2
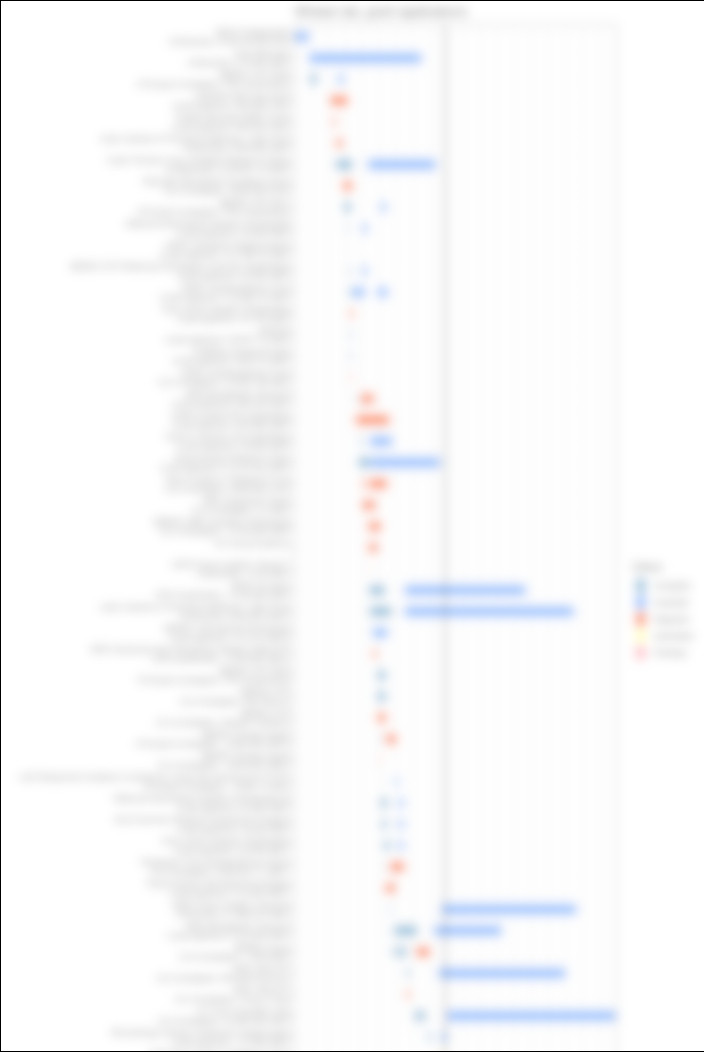
I keep R markdown records of grants (submitted, rejected/accepted), manuscripts, lab members, & teaching that are visualized with ggplot2. This helps me see the big picture & plan future responsibilities.
Day eleven: Plotting timelines in R w ggplot2
I keep R markdown records of grants (submitted, rejected/accepted), manuscripts, lab members, & teaching that are visualized with ggplot2. This helps me see the big picture & plan future responsibilities.
Comments
https://github.com/giocomai/ganttrify
whel.lab <- data.frame(matrix(ncol=4,nrow=0,
dimnames=list(NULL, c("Name", "Status", "Start.date", "End.date"))))
whel.lab[nrow(whel.lab) + 1,] <- c("Event X", "Status1", "2020-01-01", "2020-12-31")
...
levels = unique(whel.lab$Name[nrow(whel.lab):1]))
whel.lab$Status <- factor(whel.lab$Status,
levels = c("Status1",
"Status2"))
whel.lab$End.date <- as.Date(whel.lab$End.date, format="%Y-%m-%d")
ymax = https://End.date,
x = Name,
colour = Status,
geom = "linerange",
data = whel.lab,
size = I(5)) +
"Status2" = "#91BFFD")) +
geom_hline(yintercept=Sys.Date()) +
coord_flip() +
theme_bw() +
theme(panel.grid.major.x = element_line(colour = "grey", linetype="dashed"),