
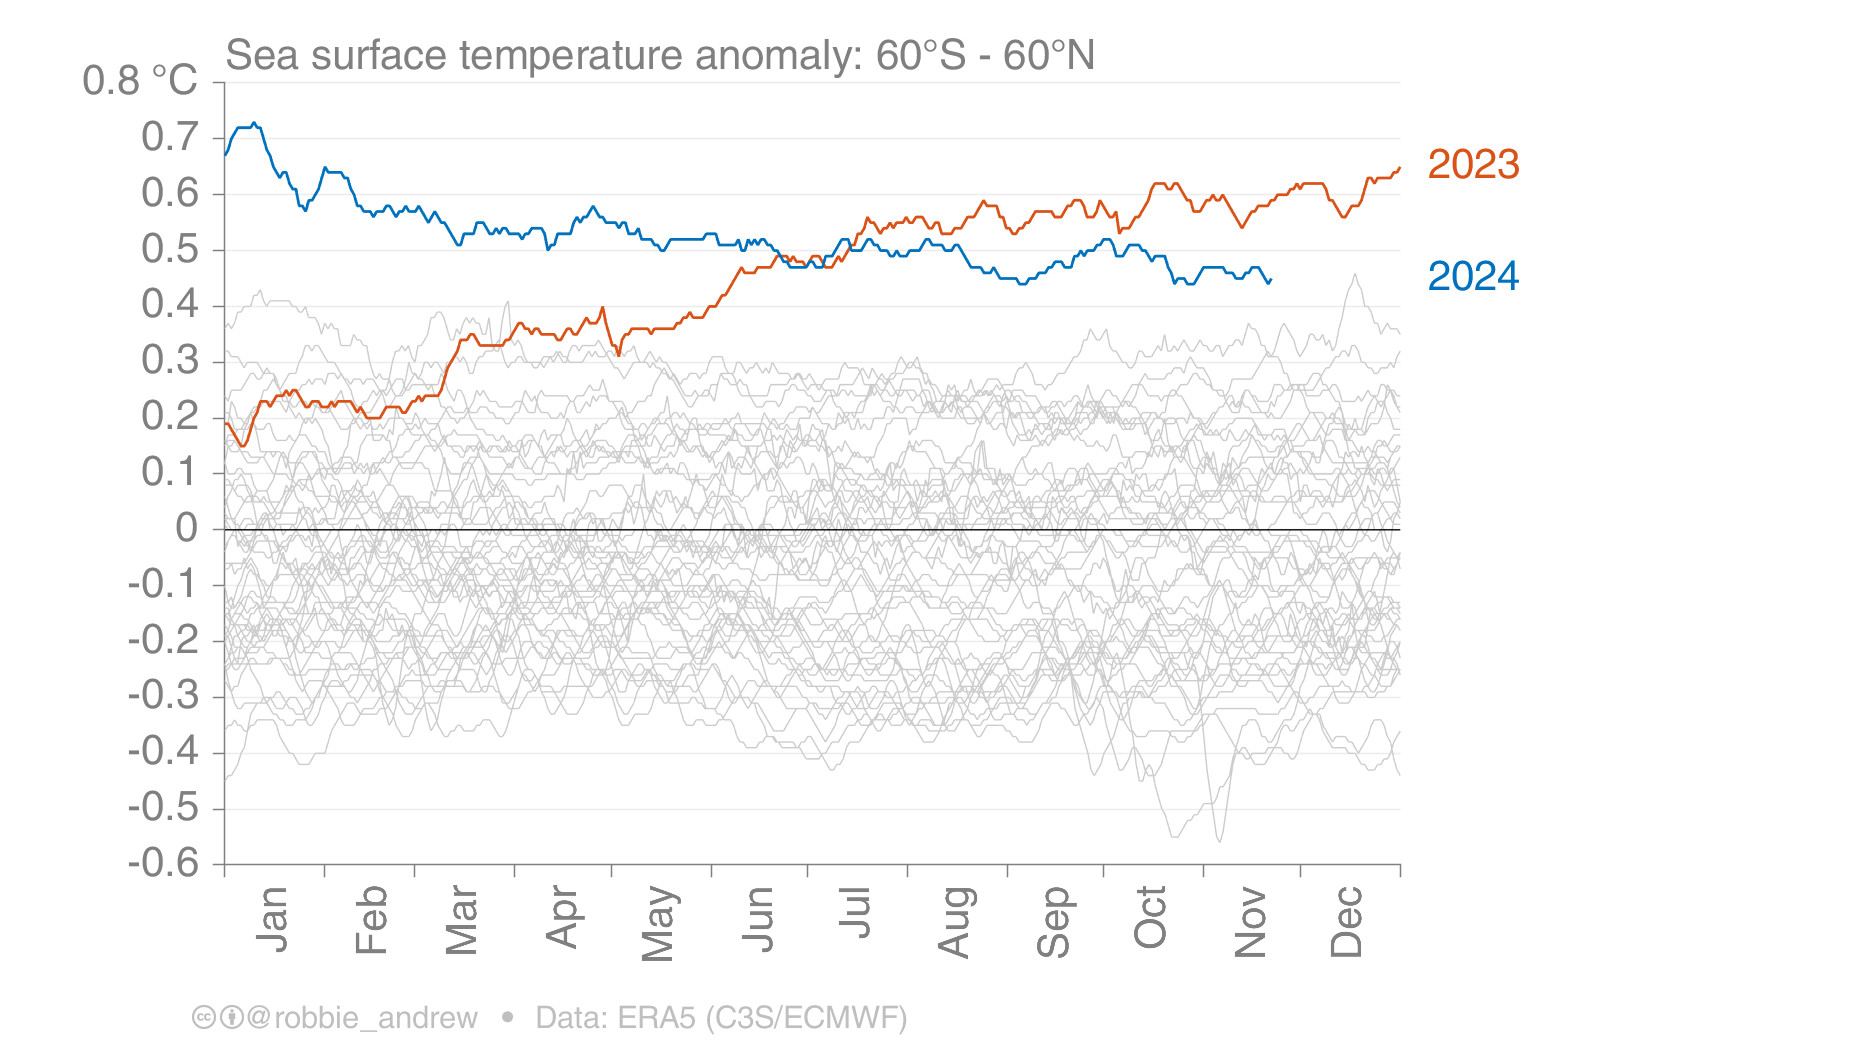
Many of us have seen this figure, which shows the dramatic increase in sea-surface temperatures, breaking historical records. Looks scary. However...
Short🧵 1/5
Short🧵 1/5
Comments
// this is a good sentence
https://robbieandrew.github.io/ppm/
0.3375°C ((0.5 - 0.23)/8*10) //2023-2015
0.1166°C ((0.23-0.02)/18*10) //2015-1997
0.27°C warmer SST in 8 years 2023 to 2015.
0.5°C 2023
0.23°C 2015
0.02°C 1997
https://robbieandrew.github.io/ppm/
#7T7.8 this is accelerated ocean heating.
https://bsky.app/profile/thomas-boettcher.bsky.social/post/3lbrds3z64c25
#7T7.7 this is Hansen ocean value 0.1166°C warming in 10 a.
0.21°C warmer in 18 years 2015 compared to 1997
SST_60S_60N was 0.23°C 2015-Aug 2016-Aug
SST_60S_60N was 0.02°C 1997-Aug 1998-Aug
https://robbieandrew.github.io/ppm/
https://bsky.app/profile/thomas-boettcher.bsky.social/post/3lbrcwny4nc25
I am not a climate scientist, but what people "scared", as far understand, is the deviation from the expected, the probability, the standard deviation.
It's all worrying. But there's debate on how much new there is to worry about.
https://berkeleyearth.org/october-2024-temperature-update/
Through 2023, nothing unusual.
https://www.epa.gov/climate-indicators/climate-change-indicators-ocean-heat
#fracking industry and the biosphere/economic breakdown this will cause..
#bigclimate
[1] https://pubs.acs.org/doi/10.1021/es803496a
[2] https://essd.copernicus.org/preprints/essd-2024-519/