
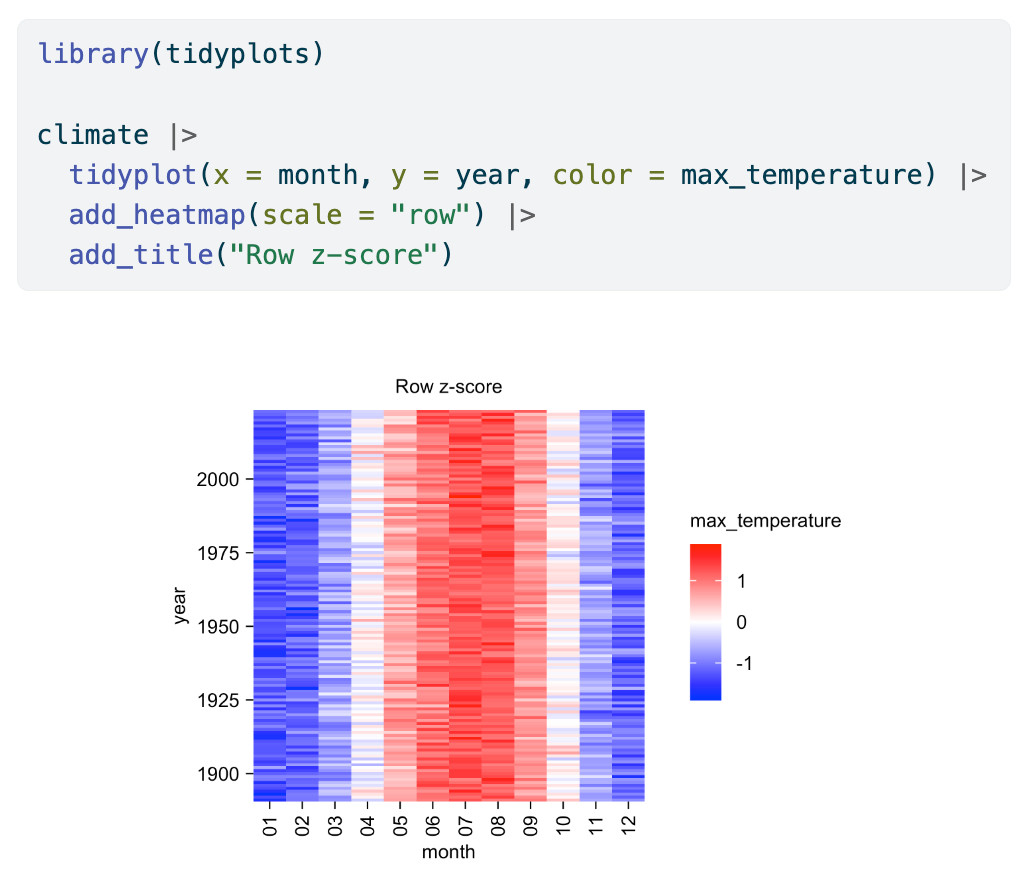
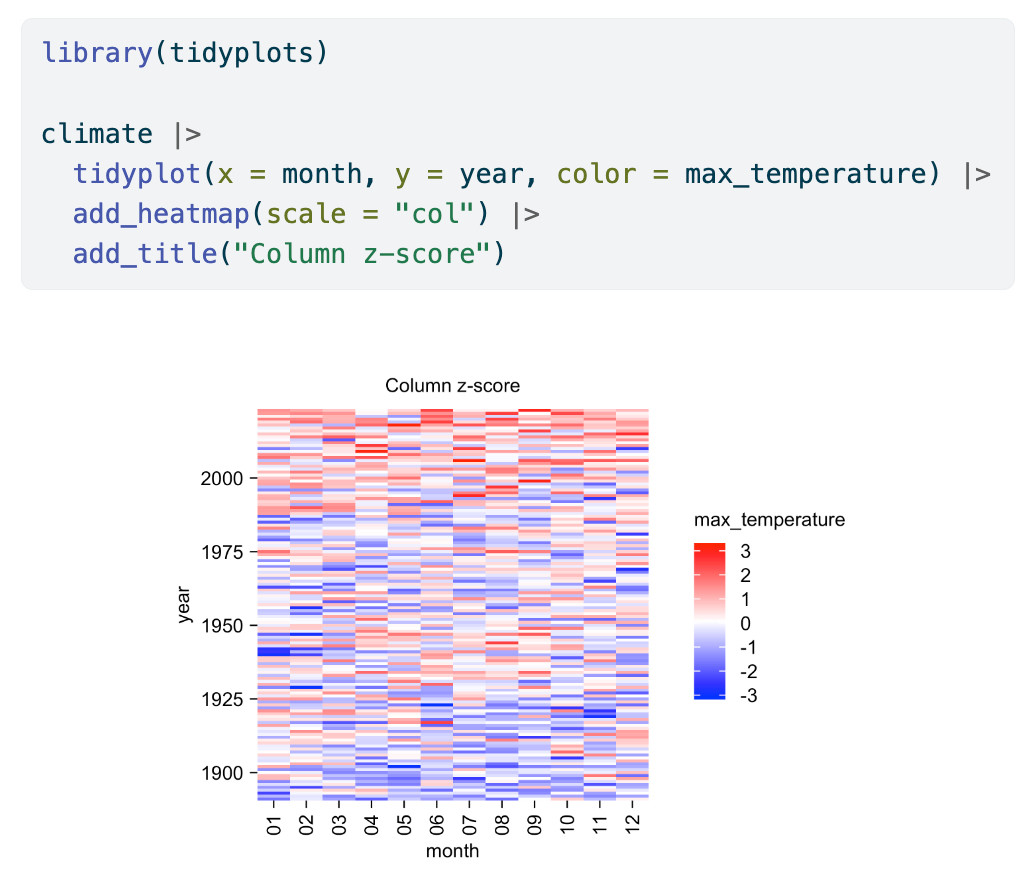
This is how you can visualize z-scores in #tidyplots heatmaps 🚀
This is especially useful when you want to focus on the dynamics within rows or columns.
#rstats #dataviz #phd
This is especially useful when you want to focus on the dynamics within rows or columns.
#rstats #dataviz #phd
1 / 2
Comments