
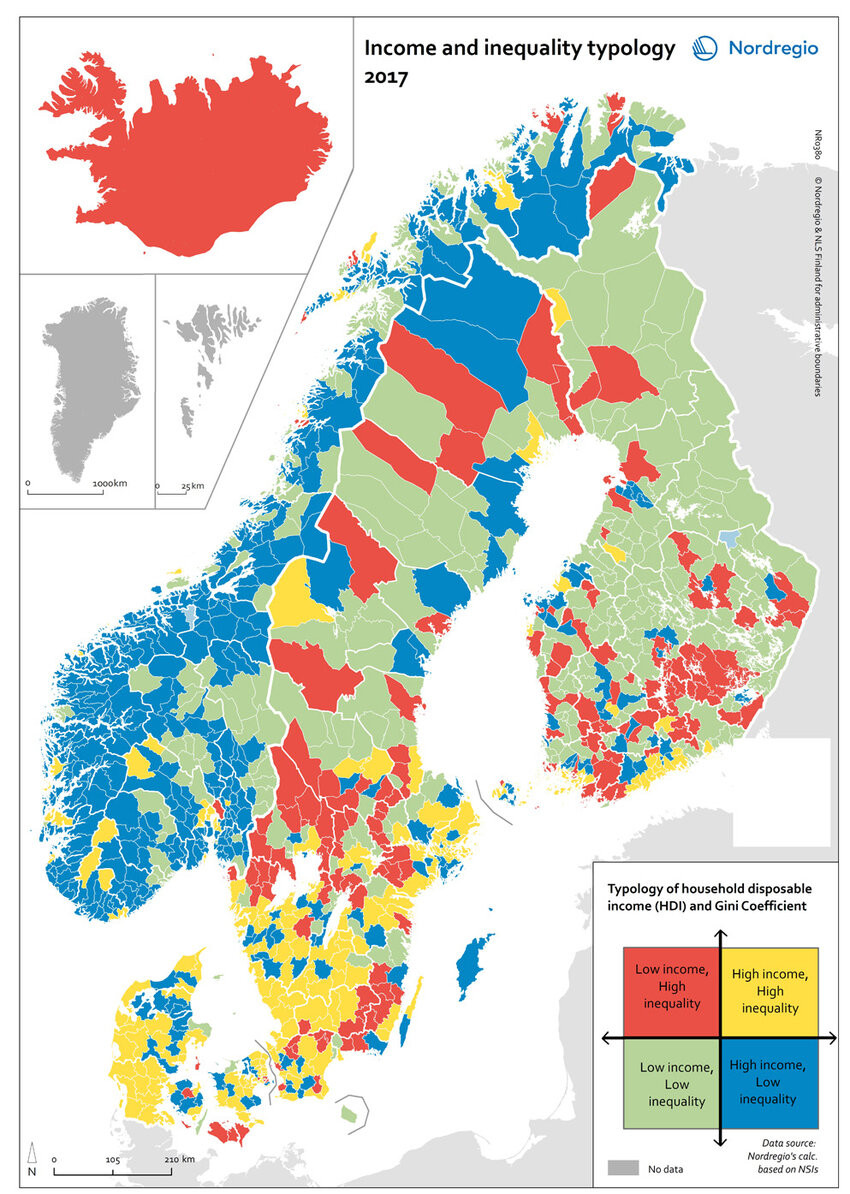
Data visualization tells powerful stories. I use network maps for connections but only when they truly support the narrative. This 2x2 matrix brilliantly shows connectivity distribution vs income levels.
What story do you see in this visualization?
#storytelling #visualization #data
What story do you see in this visualization?
#storytelling #visualization #data
Comments