
California’s renewables development is undeniably driving down emissions.
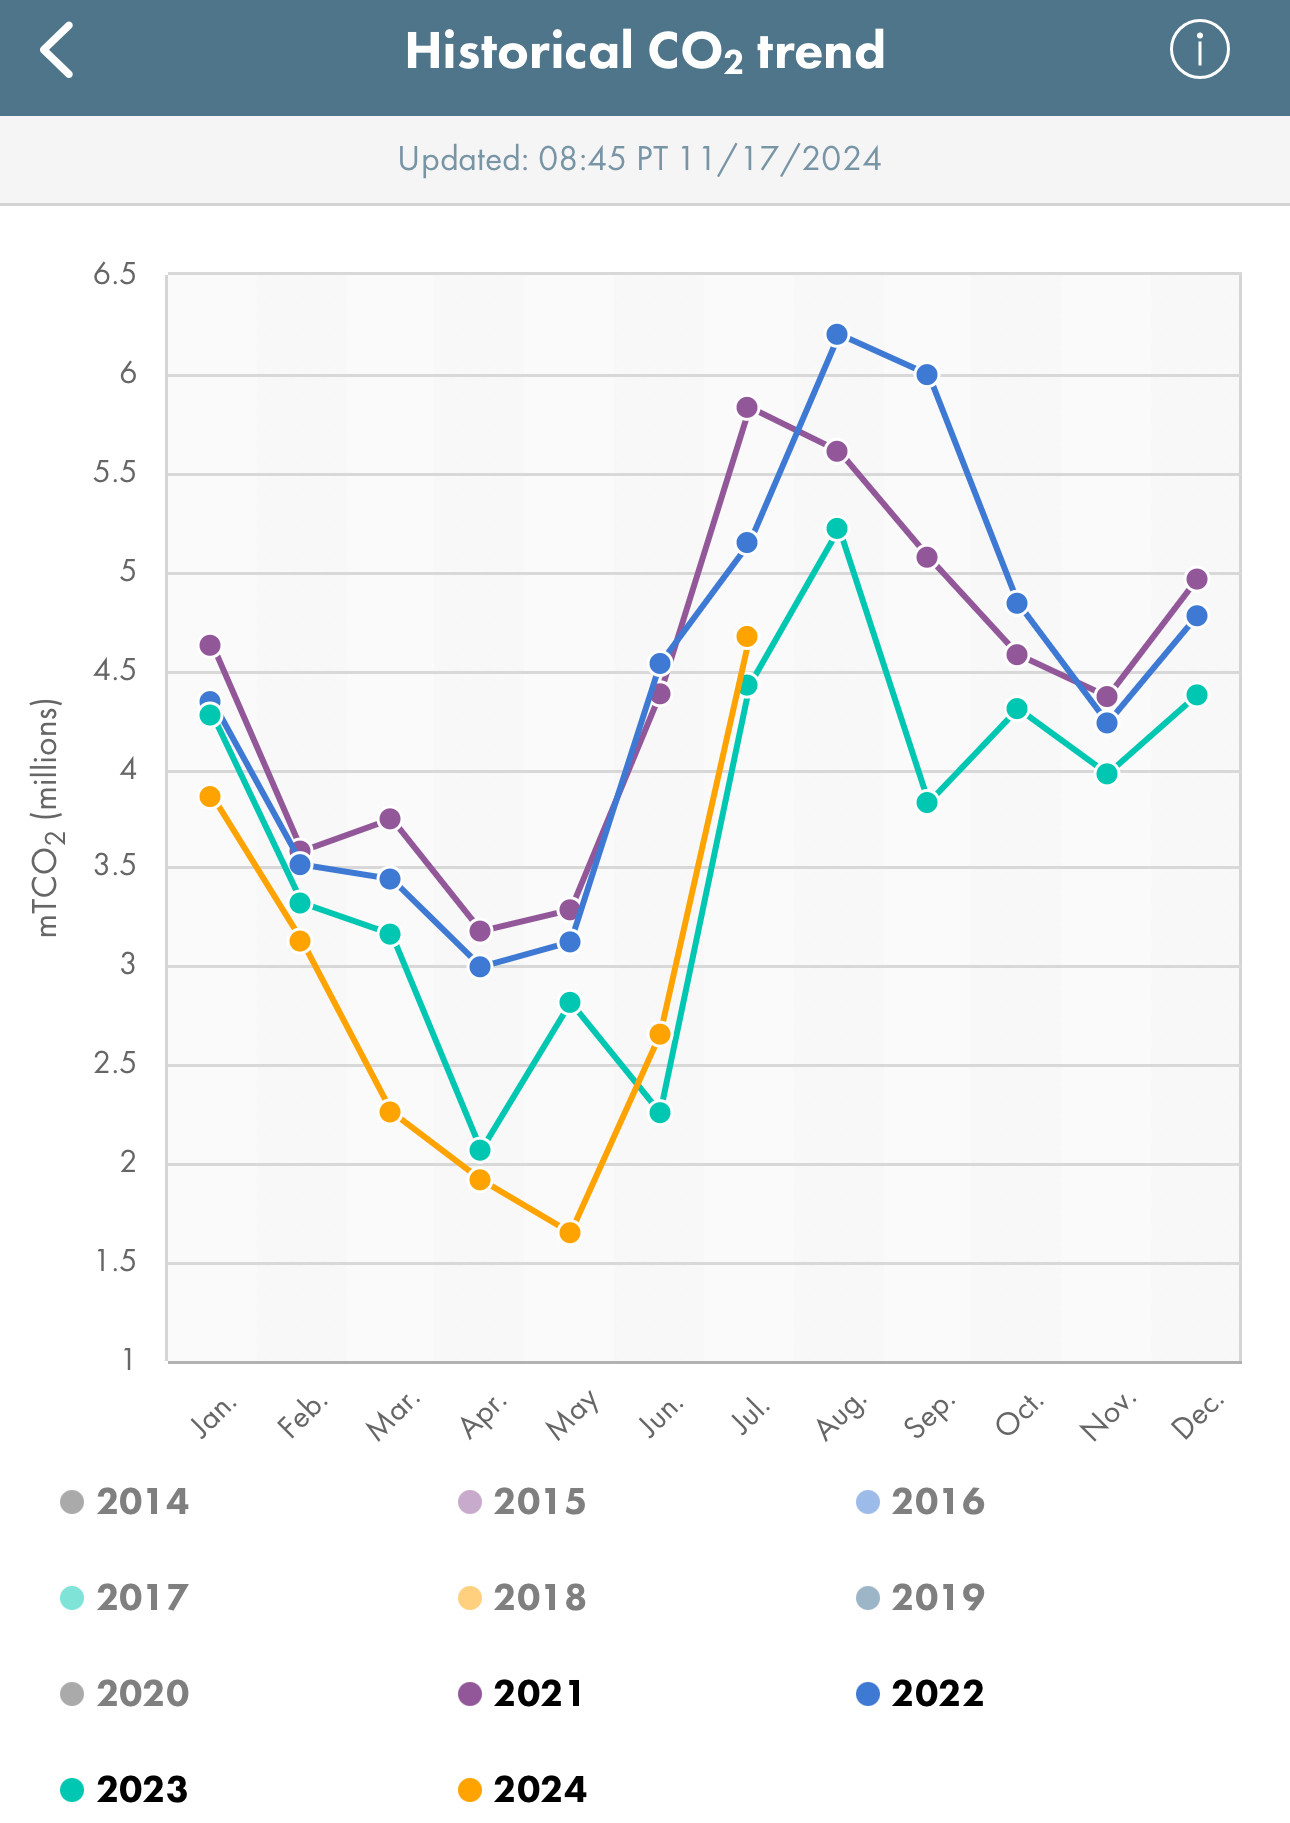
Chart below from CAISO data showing 2021-2024 emissions.
The increasingly deep drops in the spring and early summer is solar carrying the (often vast) majority of California’s grid.
It’s almost like renewables stuff works.
Chart below from CAISO data showing 2021-2024 emissions.
The increasingly deep drops in the spring and early summer is solar carrying the (often vast) majority of California’s grid.
It’s almost like renewables stuff works.
Comments
Who is going to be “C”?
Question: does France's power grid have notably higher emissions at certain times of year?
If you look at May, the highest line is 2021, and each line under the next is 2022, 2023 with the bottom line being 2024.
Screenshot from app ISO Today.
Demand has increased in CAISO, particularly in recent years.
I love Texas is building one of the biggest in the US (875MW) too
Here, that equates to roughly 326,000 cars removed from the road for one year.
https://tinyurl.com/2ptesj2a