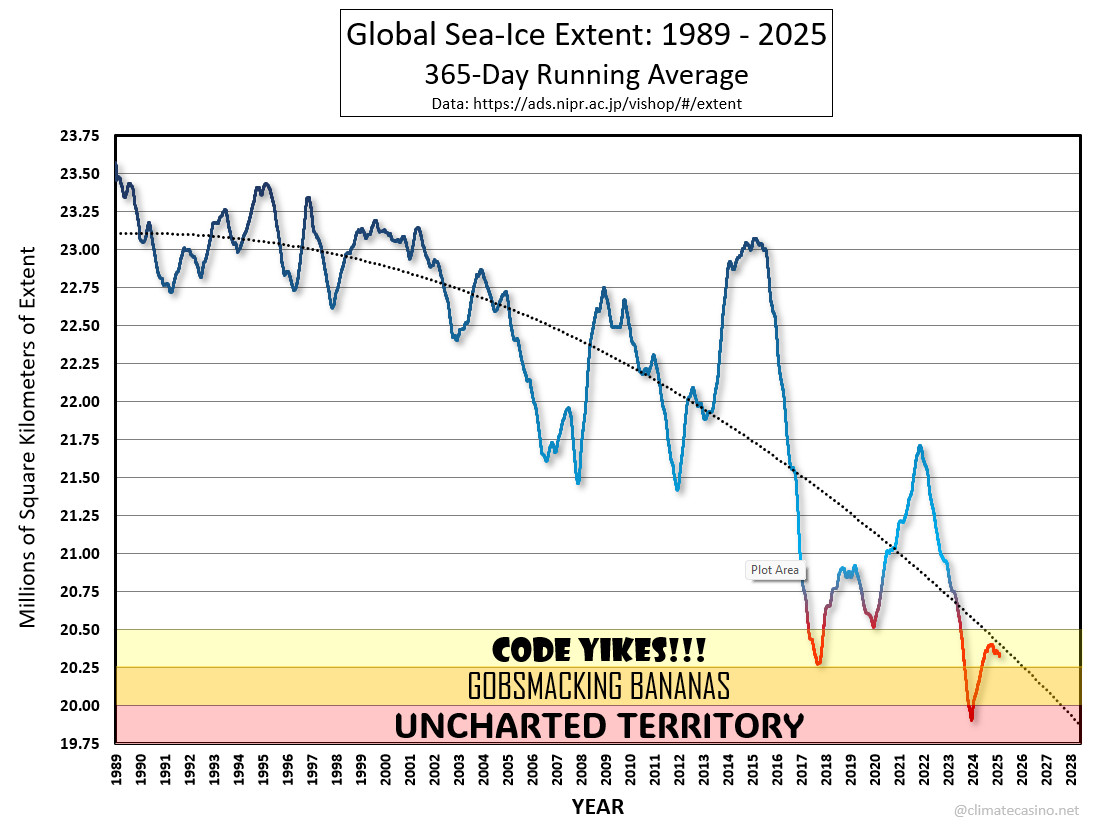
After setting an all-time record minimum on February 9th, the 365-day running mean for global sea-ice extent is headed back towards "gobsmacking bananas" territory:
Comments
Log in with your Bluesky account to leave a comment
Out of curiosity: assuming this projection is accurate (probably still too optimistic given the "forcings" and accelerations we are seeing): when is the best fit curve intercepting the x axis (i.e. no ice)?
Also, are these data taken from a website or have you modelled the graph yourself?

Comments
It's kinda-sorta like the "All new... Show" or "Great Great... Grandparents"
Also, are these data taken from a website or have you modelled the graph yourself?