
You want to create a bespoke graph in python? It's probably possible - with a bit of time and perserverance.🤓
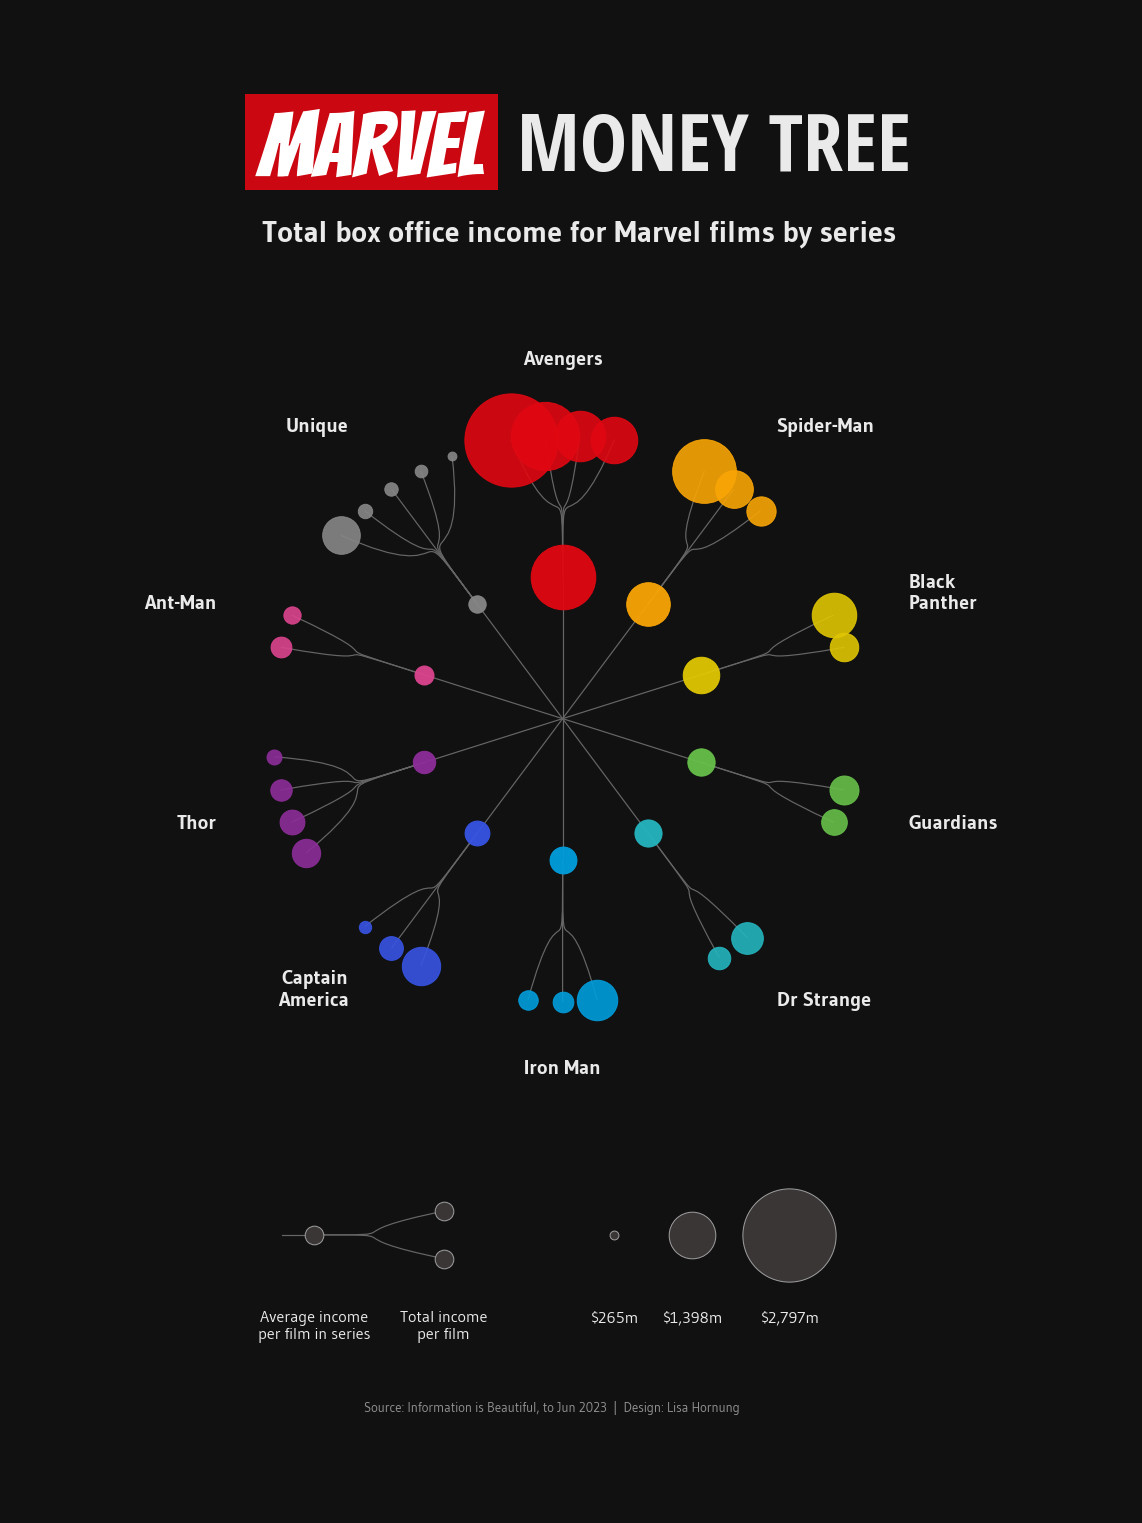
Meet a radial tree diagram of Marvel film box office performance. 100% made in python using numpy, #matplotlib and bezier curves. Dont judge the code 😅 https://github.com/Lisa-Ho/small-data-projects?tab=readme-ov-file#032025-marvel-money-tree
#dataviz
Meet a radial tree diagram of Marvel film box office performance. 100% made in python using numpy, #matplotlib and bezier curves. Dont judge the code 😅 https://github.com/Lisa-Ho/small-data-projects?tab=readme-ov-file#032025-marvel-money-tree
#dataviz
Comments
I've used all of Python/R/D3 in the past year, for quick data review and cleaning I'm usually using R (but Python for scraping, for instance!) then I pick one of the three for dataviz (+ sometimes Affinity afterwards)