
🚨 The stupidest chart you'll see today ... Trade tariffs by Dunning-Kruger
https://on.ft.com/3FTu2Dd
https://on.ft.com/3FTu2Dd
Comments
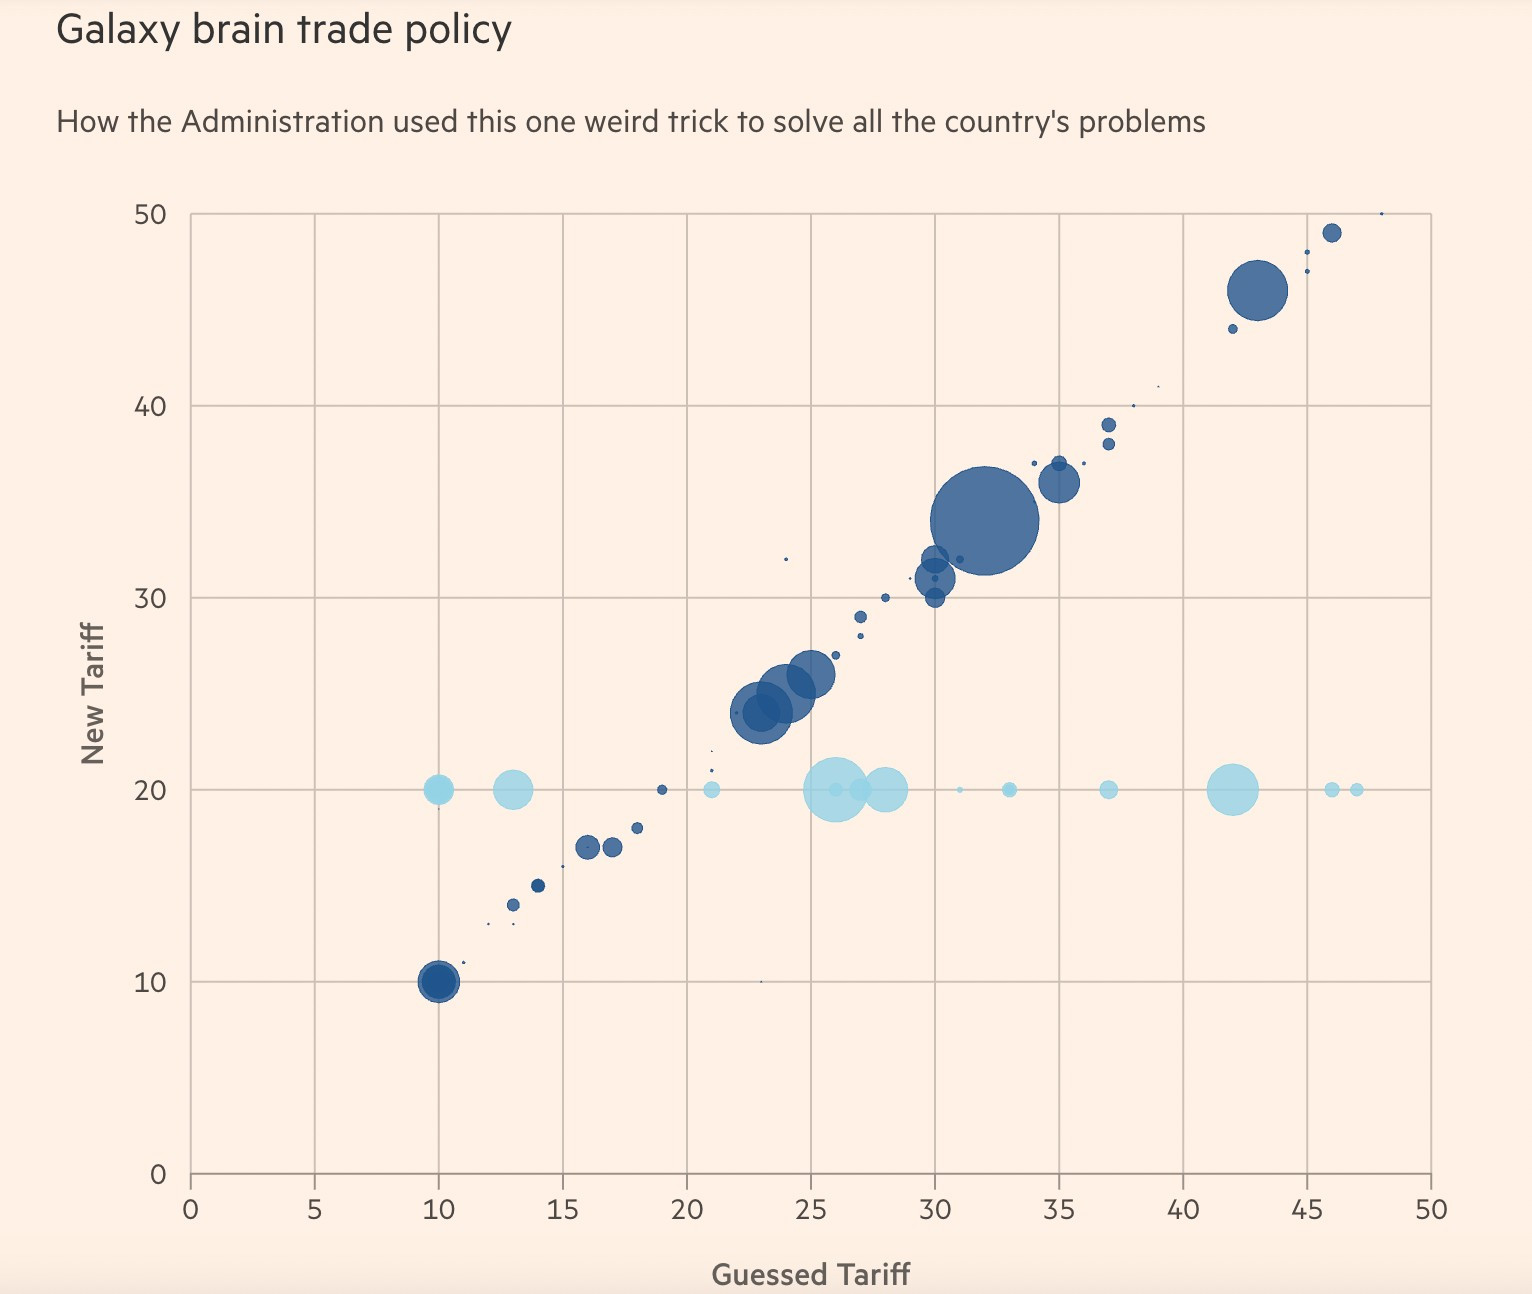
Bubbles sized by US imports from each country.
EU members all get 20% tariff and are light blue.
Nice.
Would be cool if FT (and maybe other pubs) adopted a visual indicator of interactivity for the benefit of old-timers who grew up reading charts on dead paper ...
eu: $235.6bn surplus, $605.8bn exports, 235.6/605.8 = 39%
indonesia: $17.9bn surplus, $28.1bn exports, 17.9/28.1 = 64%
india: $45.7bn surplus, $87.4bn exports, 45.7/87.4 = 52%
vietnam: $123.5bn surplus, $136.6 exports, 123.5/136.6 = 90%
"claimed tariffs charged"
According to the literal 4 column spreadsheet they used, if a country halts all exports to the US, we’d be actively paying them infinite cash. Clearly a sign it’s a solid model.