
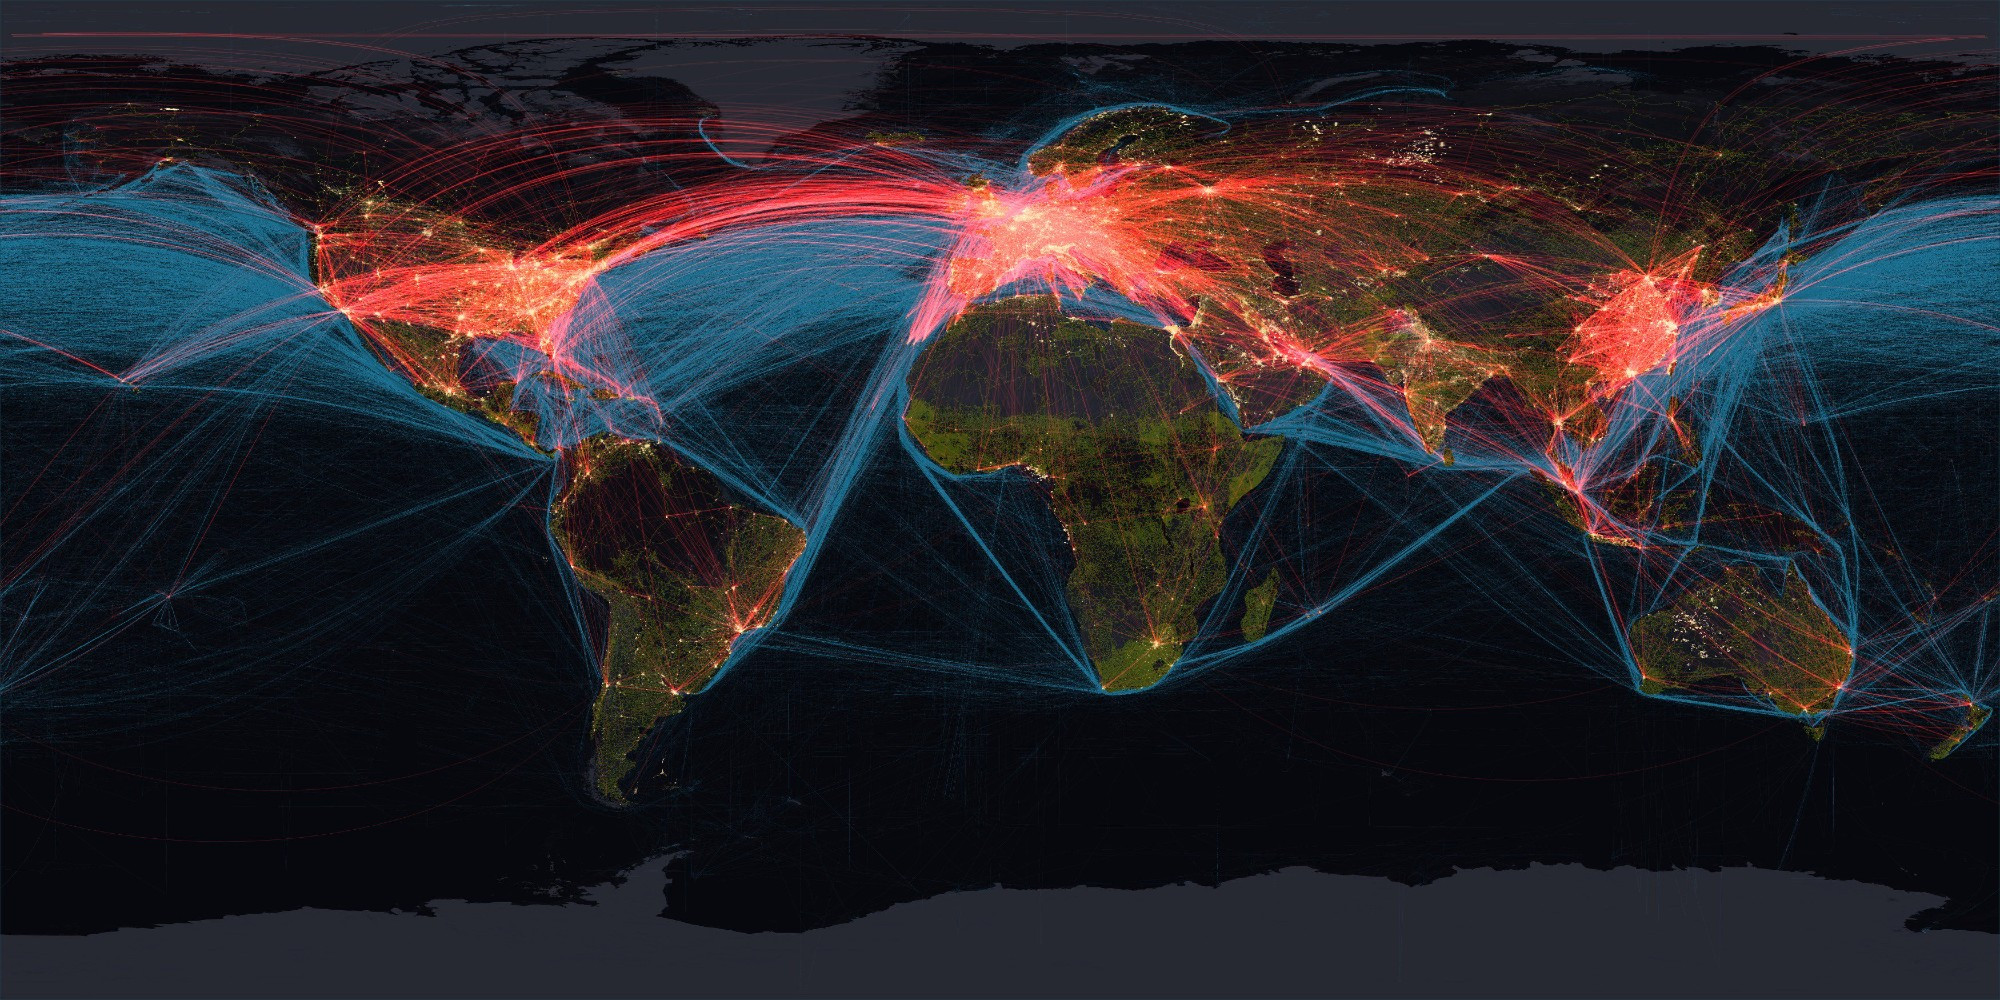
On one of the busiest travel days of the year in the United States, here's a visualization of the human footprint...
(red = flights, blue = ships, green = roads, yellow = lights)
Graphic from NOAA's Science On a Sphere: https://sos.noaa.gov/catalog/datasets/human-transportation/
(red = flights, blue = ships, green = roads, yellow = lights)
Graphic from NOAA's Science On a Sphere: https://sos.noaa.gov/catalog/datasets/human-transportation/
Comments
If so, it would be much worse now!
No wonder the night sky is no longer visible to most.
What have we lost when we can’t connect with the stars ,planets, Milky Way ….?
And of course, there are the emissions/pollution(which perpetuate our global dimming Faustian bargain)and all the habitat destruction.😭
https://medium.com/@aliounegdiop/president-bassirou-diomaye-faye-discovering-the-senegalese-geopolitical-landscape-through-global-0d614605ac46