
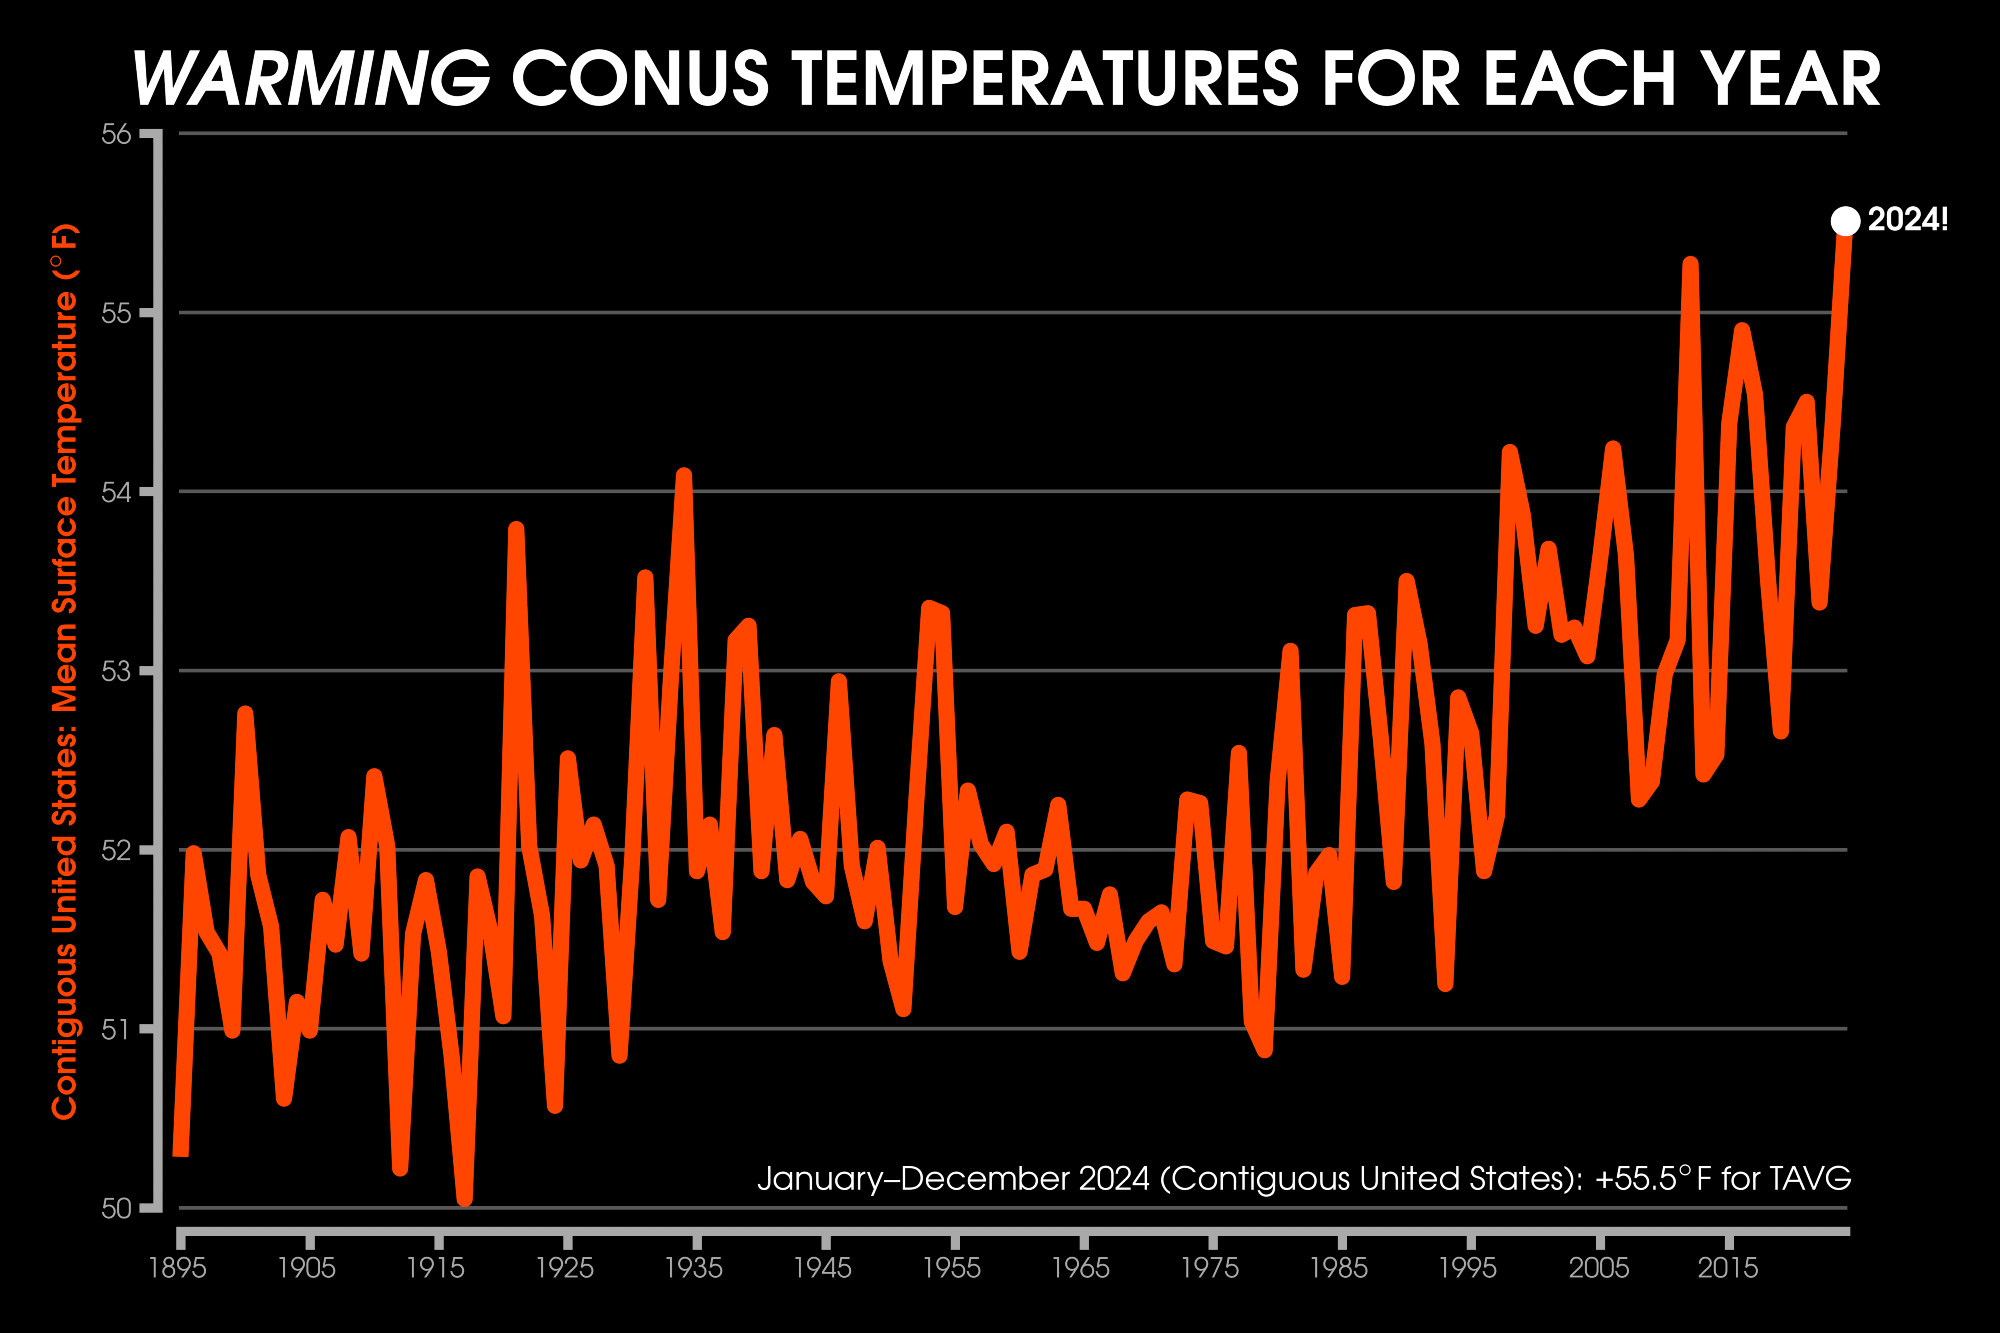
I just included a new graphic on my climate indicators page showing average yearly temperatures for the contiguous United States (CONUS) from 1895 to 2024.
This visualization will now be updated annually at https://zacklabe.com/climate-change-indicators/. Data is from NOAA NClimGrid.
This visualization will now be updated annually at https://zacklabe.com/climate-change-indicators/. Data is from NOAA NClimGrid.
Comments