
A lot of folks asked why I through this January's record global temperatures were so unexpected.
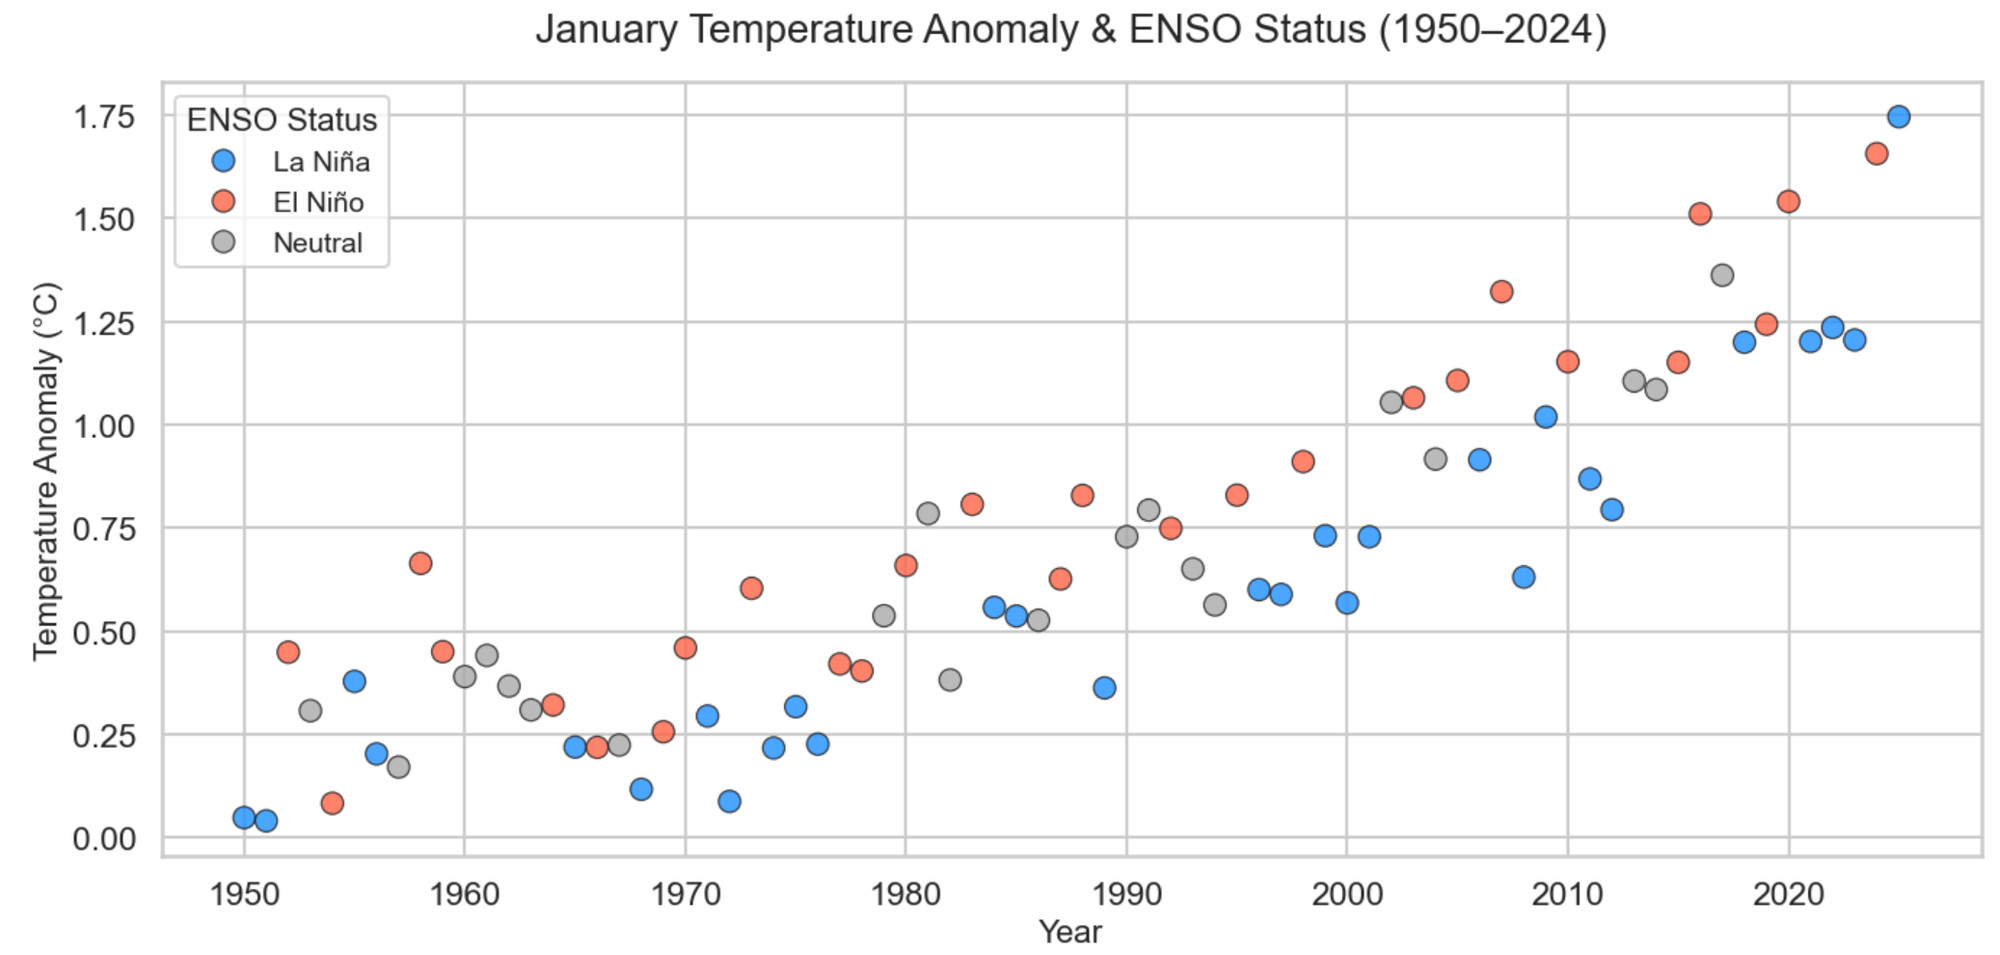
I think this graph shows it pretty clearly: pretty much every other January with La Nina conditions has been a cooler than the surrounding years.
I think this graph shows it pretty clearly: pretty much every other January with La Nina conditions has been a cooler than the surrounding years.
Comments
That should count as a La Niña.
https://bsky.app/profile/leonsimons.bsky.social/post/3lhogmt3rgk2y
If you specify, I can have a look.
Here's PDO from 1950 (note that NASA & NOAA estimated (in Loeb et al. 2021) Earth's Energy Imbalance (EEI) to decrease when PDO would decrease (which it did), but EEI reached about +1.4 W/m², averaged over the past 4 years).
https://bsky.app/profile/leonsimons.bsky.social/post/3lholflmi4c2r
The annual increases in global temperatures are now starting to crowd out the ENSO cycles.
Deep ocean heat content has been increasing very fast. The higher the heat content of the deep ocean, the faster the upper layer can be replenished with heat following any weather/cyclical cooling.
https://en.m.wikipedia.org/wiki/Abstract_algebra
But yeah the forecast looks like 2025 as whole might be neutral (https://www.cpc.ncep.noaa.gov/products/analysis_monitoring/lanina/enso_evolution-status-fcsts-web.pdf)
But looking at the temperature deviation from trend for all months, January deviation during la nina it is not outside the distribution
https://bsky.app/profile/denismongin.bsky.social/post/3lhlnjw7nec2m
How are you detrending the underlying data? Linear or lowess?
Good eyeball 😆
So, ~5% of proba of happening. Surprising, but not totally off.
Yeah, agree, hard to see directly the stats, but look extreme, but not unprecedent to me. I'll see if I have time to fit an actual gaussian and have a number
The distribution on both side of the smoothing trend would be another way to represent it also.
Thanks for the graph
Its per definition a decline in ocean heat uptake in a region triggering super marine heatwave - look at the one in 2024 in the NP - it reached local max values of 8 °C above the 1981-2011 average... NullSchool nicely to watch...
We are now triggering a major mass extinction event as this feedback cascade is mighty!
therefore last: SH MHWs are also intensifying further:
and how the oxygen fraction see it - ventilation of subsurface waters with oxygen is vertical mixing!
"tenfold increase in SOL-EI by comparing 2013-2022 with the previous decade!
We had a massive shift in energy into the upper ocean during the last months
They wondered if this had been important: "A shift in global warming induced e.g. by an upwelling of previously stored deeper water temperatures"
The result is ocean surface warming accelerating
Here this threat
"the underlying rate of change of GMSST rises in proportion with Earth's energy accumulation from 0.06 K decade–1 during 1985–89 to 0.27 K decade–1 for 2019–23."
This should be testable within 1-2 yrs
Not that anything gets done about it, either. But it is interesting. Thank you.
Here the most recent numbers on ocean heat uptake which are an atrocity...
Main problem is that we missed the largest feedback cascade - its the oceans, stupid!
Its accelerating ocean heat uptake and sky-rocking stratification forming a feedback loop...
Here some studies on this topic:
In the TWP, the cloud-SST relation has been subject to the analysis methods with satellite observations
The negative relationship is revealed only when the daily SST is weighted with the clear-sky fraction from a geostationary satellite.
Just wondering because the font types are exactly the same but your Y axis is in kelvin.