
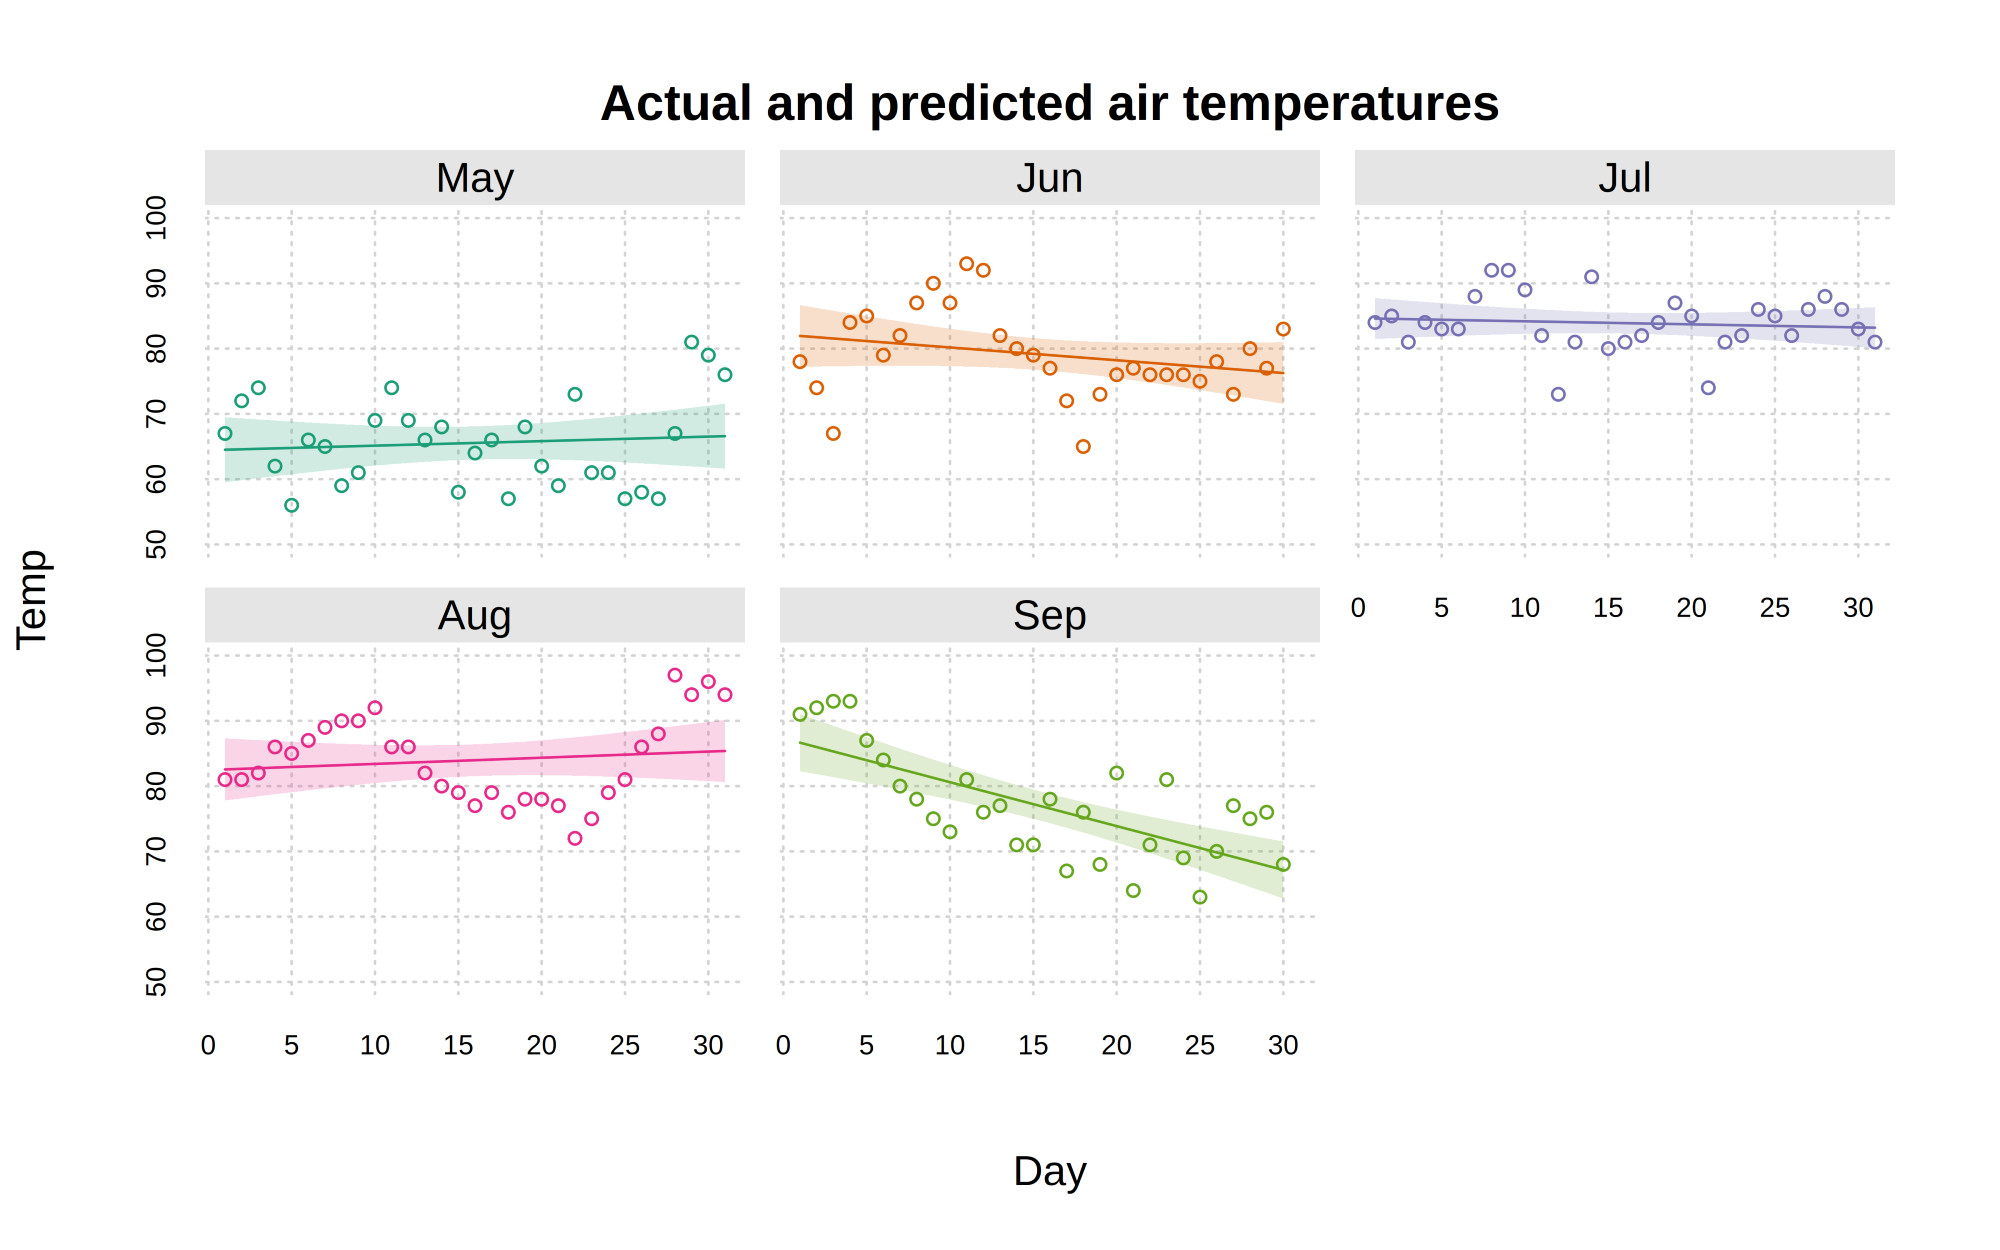
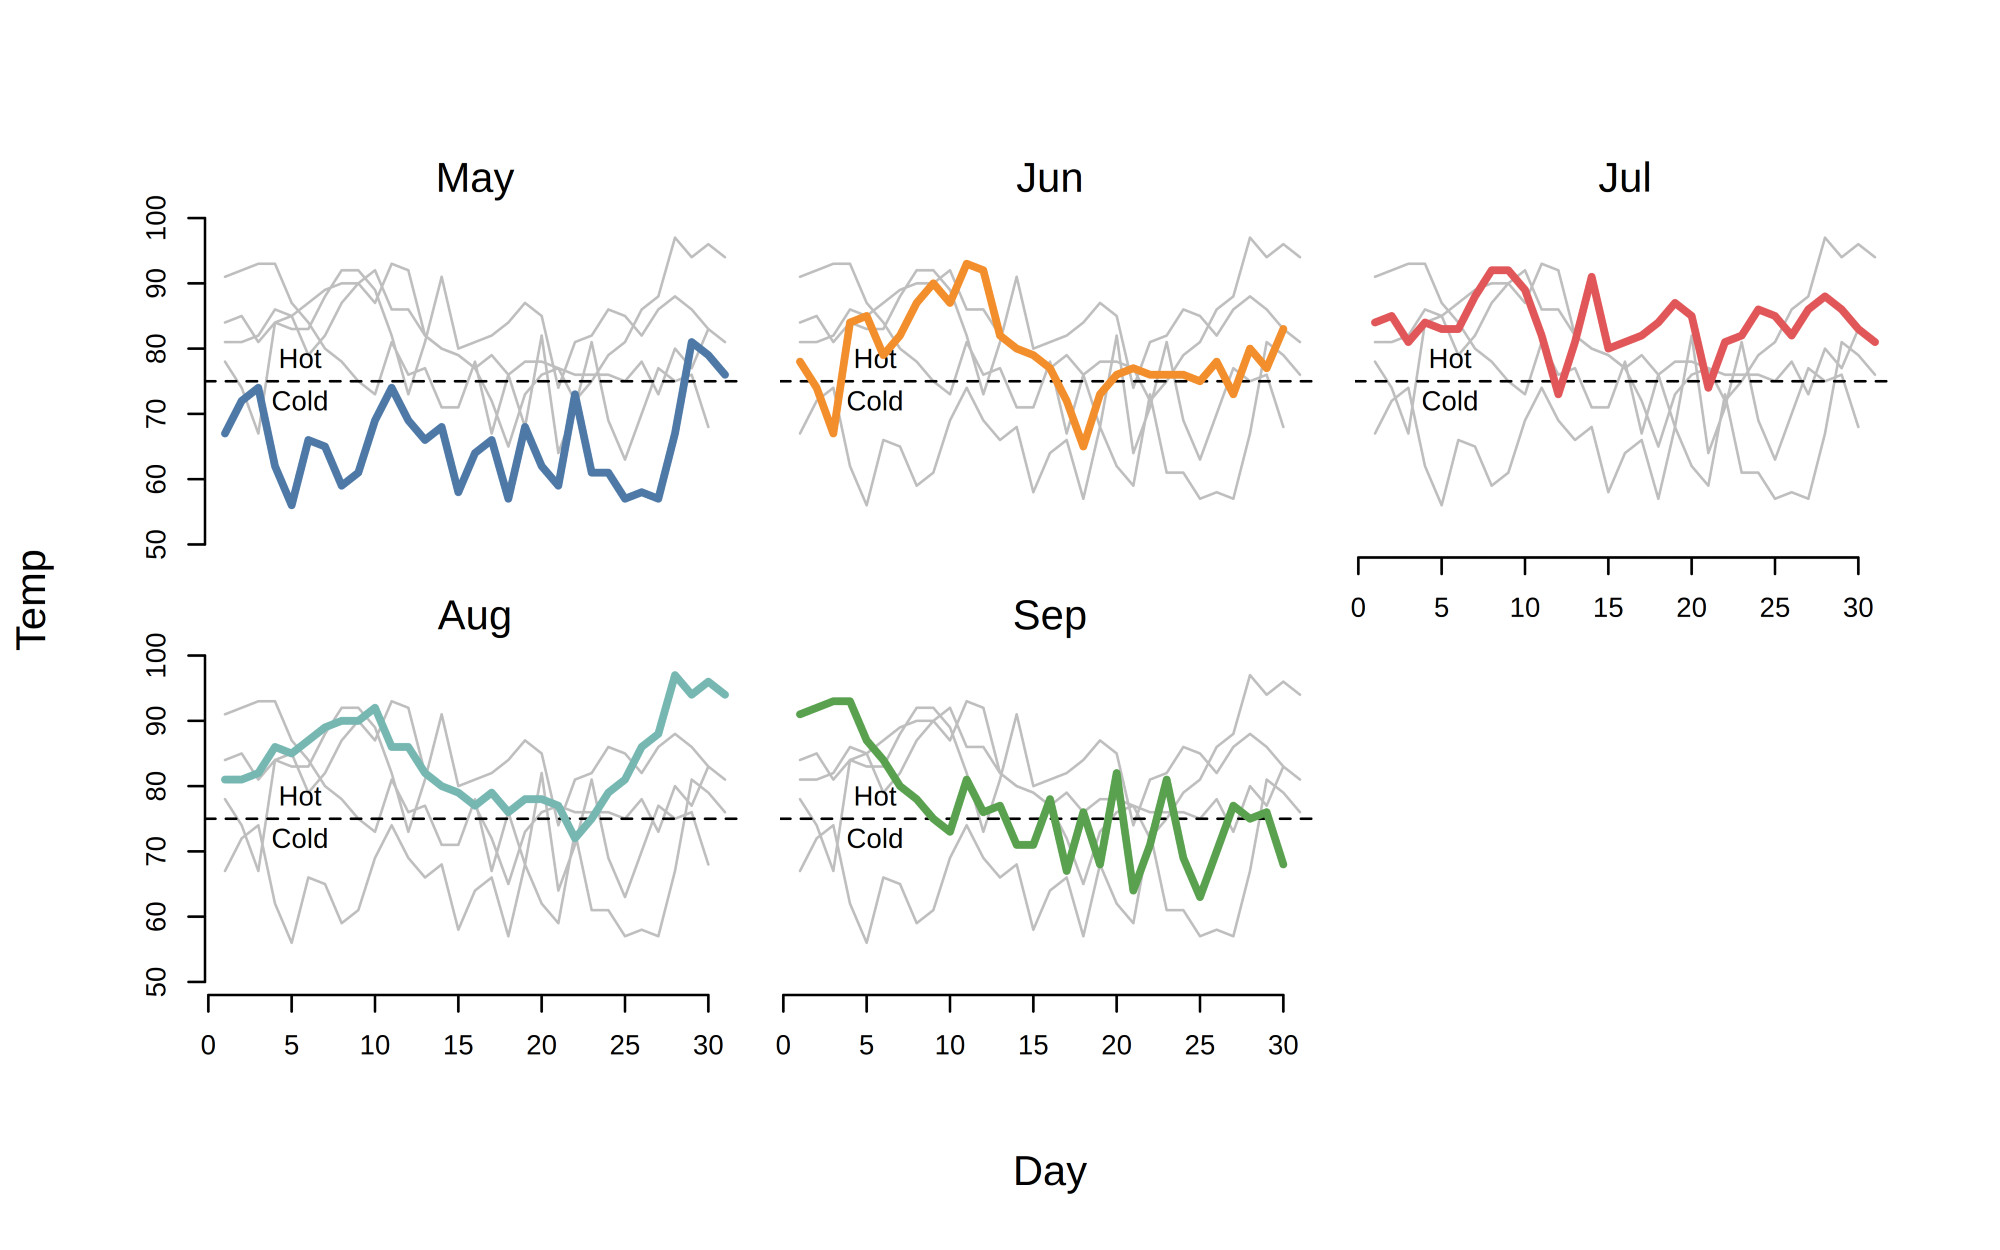
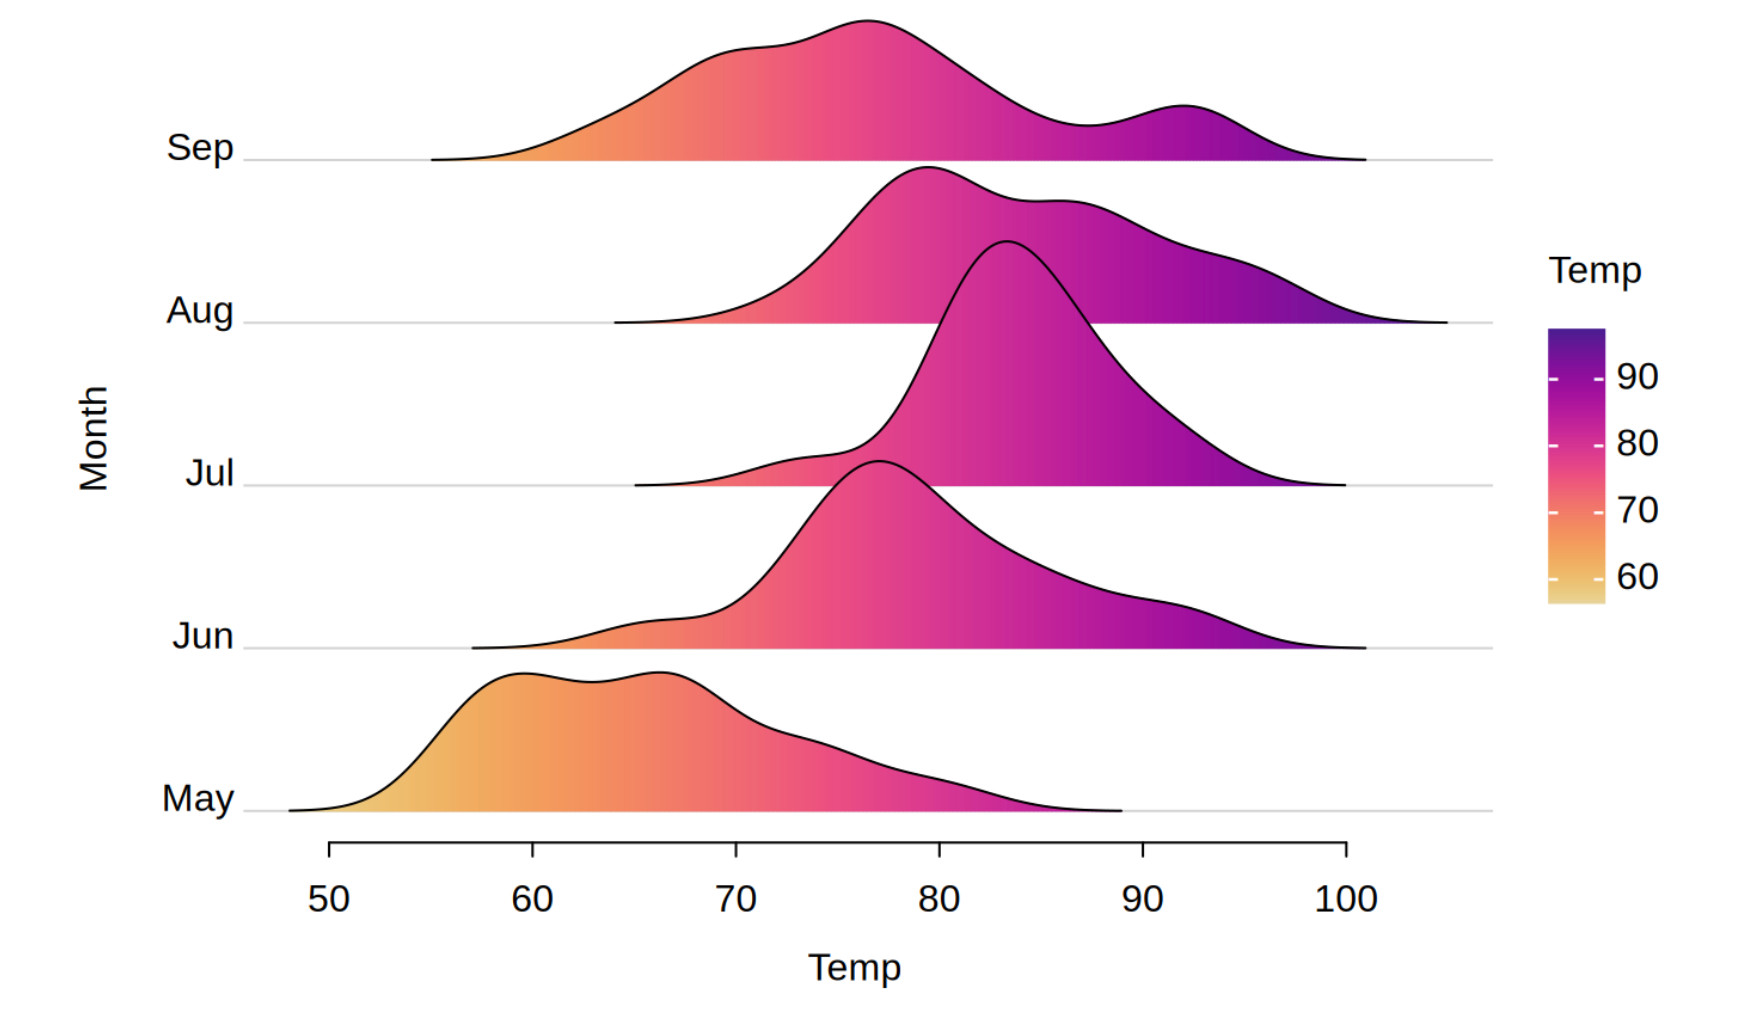
{tinyplot} 0.3.0 is out! 🚨
It's a lightweight #Rstats 📦 to draw beautiful and complex plots, using an ultra-simple and concise syntax.
This is a massive release! @gmcd.bsky.social @zeileis.org and I worked hard to add tons of new themes and plot types.
Check it out!
https://grantmcdermott.com/tinyplot/
It's a lightweight #Rstats 📦 to draw beautiful and complex plots, using an ultra-simple and concise syntax.
This is a massive release! @gmcd.bsky.social @zeileis.org and I worked hard to add tons of new themes and plot types.
Check it out!
https://grantmcdermott.com/tinyplot/
1 / 4

Comments
https://bsky.app/profile/jbengler.de/post/3lgxt2myto22u
This is the default for tinyplot(y ~ x) with categorical y.
I tried to add to the draw argument, but it repeated the same points for both graphs (R)
lambda2 <- 0.7
x <- 0:10
p1 <- dpois(x,lambda1)
p2 <- dpois(x,lambda2)
dp <- data.frame(x=c(x,x),p=c(p1,p2),lambda=rep(c(lambda1,lambda2),each=length(x)))
dp$lambda <- as.factor(dp$lambda)
I've started with a GitHub issue describing the idea:
https://github.com/grantmcdermott/tinyplot/issues/305