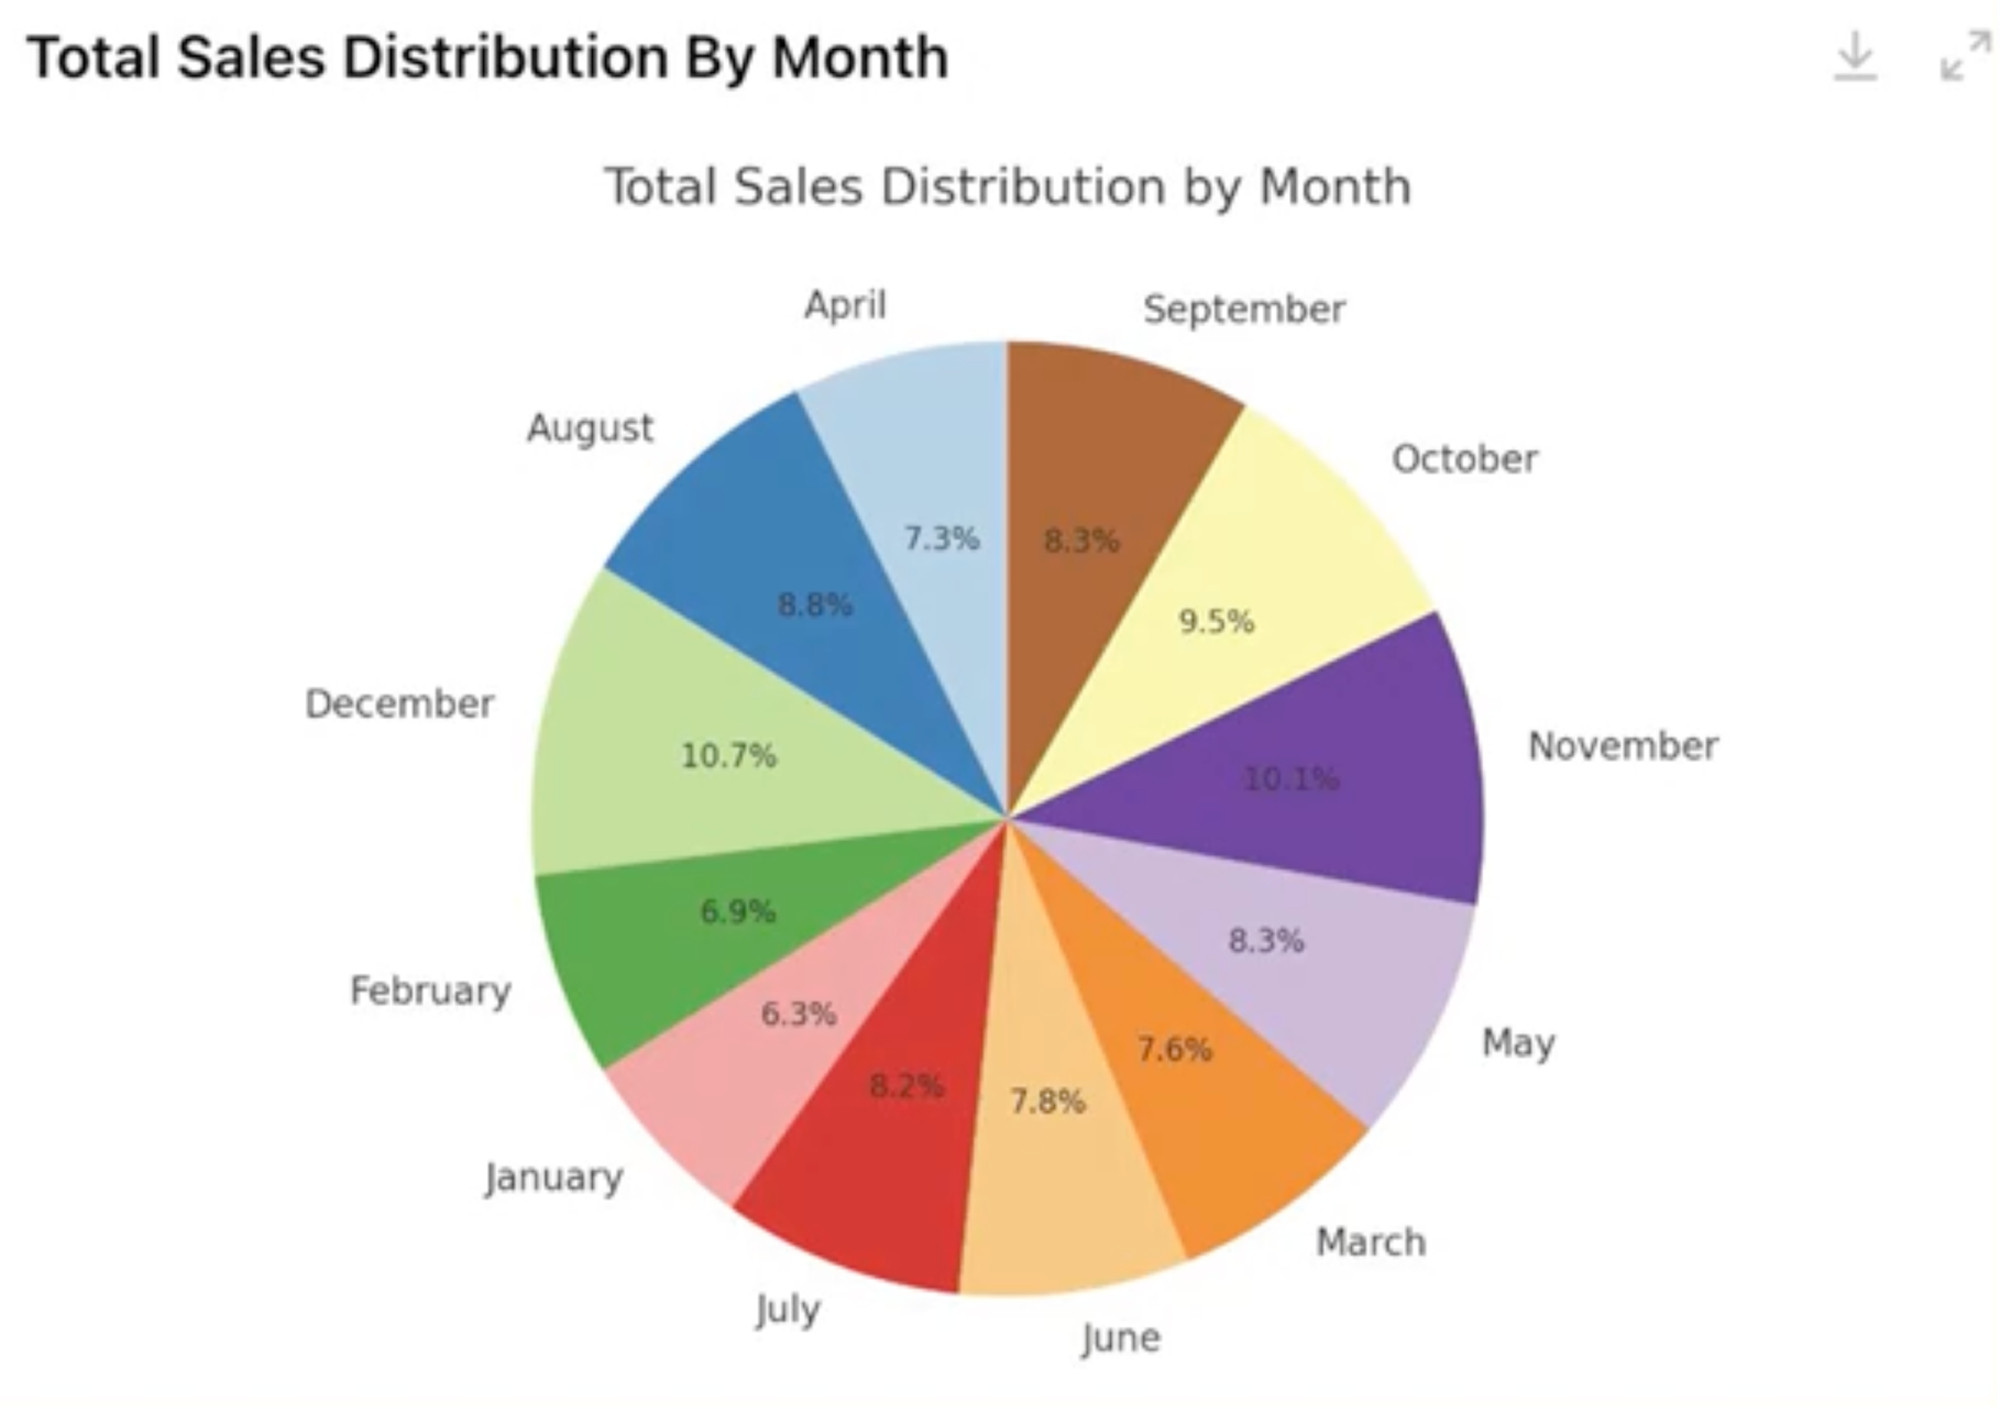
I'm still looking for uses of generative AI in visualization and information design; the results so far have been... underwhelming, to say the least. This is a chart from an AI-for-visualization course in a major online education platform. Sigh.
Comments
Log in with your Bluesky account to leave a comment
It might be not too bad to improve ggplot code according to demand (I want the ggplot code to see these columns as a radial chart where column x should be blue and column y should be green). But still you'll likely have to tweak something.
The Pudding wrote the best article I've seen on the subject, and it matches my experience. For my use, to achieve anything useful, I spend longer crafting the main prompt and follow up prompts than I would just making the viz myself. It can be useful for code, but only if you know what to aim for.
Interactive help for coding issues and the like. Figured out Virtual Layers for QGIS in two queries last week, something I had bounced off previously, because the instructions tend to be unclear and assume a fair amount of SQL familiarity, which I lack.
Stuff like ”how do I turn this type of table into that type of table” for Pandas also tend to be helpful. The results aren’t necessarily ideal solutions, but it is an useful addition to documentation and stackoverflow, especially since you can chuck it your particular case.
I think LLM coding help is a helpful tool if you are a dataviz generalist / professional: works when you have a fairly good idea of what you want to achieve, but don’t necessarily have expert knowledge of a particular tool or programming language (think regex, SQL…).
I'm working on a #dataviz course and wanted to use embedded charts in Vega, not images of Excel charts. I don't know enough or I'm not fast enough to make all those charts, and LLM helps. Also, I look at the code and slowly familiarize with how to do things. But it's always exactly the chart I want.
I honestly believe there are too many data viz tools and domain-specific languages that it would be sensible to actually learn to use everything you need by heart.
I use Pandas and Matplotlib weekly, yet still have to check syntax ever so often.
I spent all morning trying to get it to make a chart (a Likert scale with a split middle value). I had to give up, search for documentation, and adjust an example—you know, the old-fashioned way.
Best use we see for AI supported dataviz is to get around the threat of the empty paper à la “I've got this kind of data, please get me started in visualizing it”—of course, you need to be able to continue editing the result, but you've got something to work with in the first place.
I find it most useful for the tedious stuff I know I can do, but don't particularly enjoy, such as working with data APIs. That frees me up to do the interesting stuff, like creating radial charts that work.

Comments
1) making me realize I have a "style" in coding, when it repeats choices I tend to make
2) proposing interesting tweaks I had not imagined
3) proposing unworkable and convoluted ways to try to do what I wanted
The article I mentioned
https://nightingaledvs.com/what-does-ai-understand-about-a-graph/
I use Pandas and Matplotlib weekly, yet still have to check syntax ever so often.
In my limited experiences, you need to know what "good" looks like to get decent results.
That said, give it a data set and ask it to do EDA. It can be remarkable.