
Looking at grant funding time for all years from 2015-2025
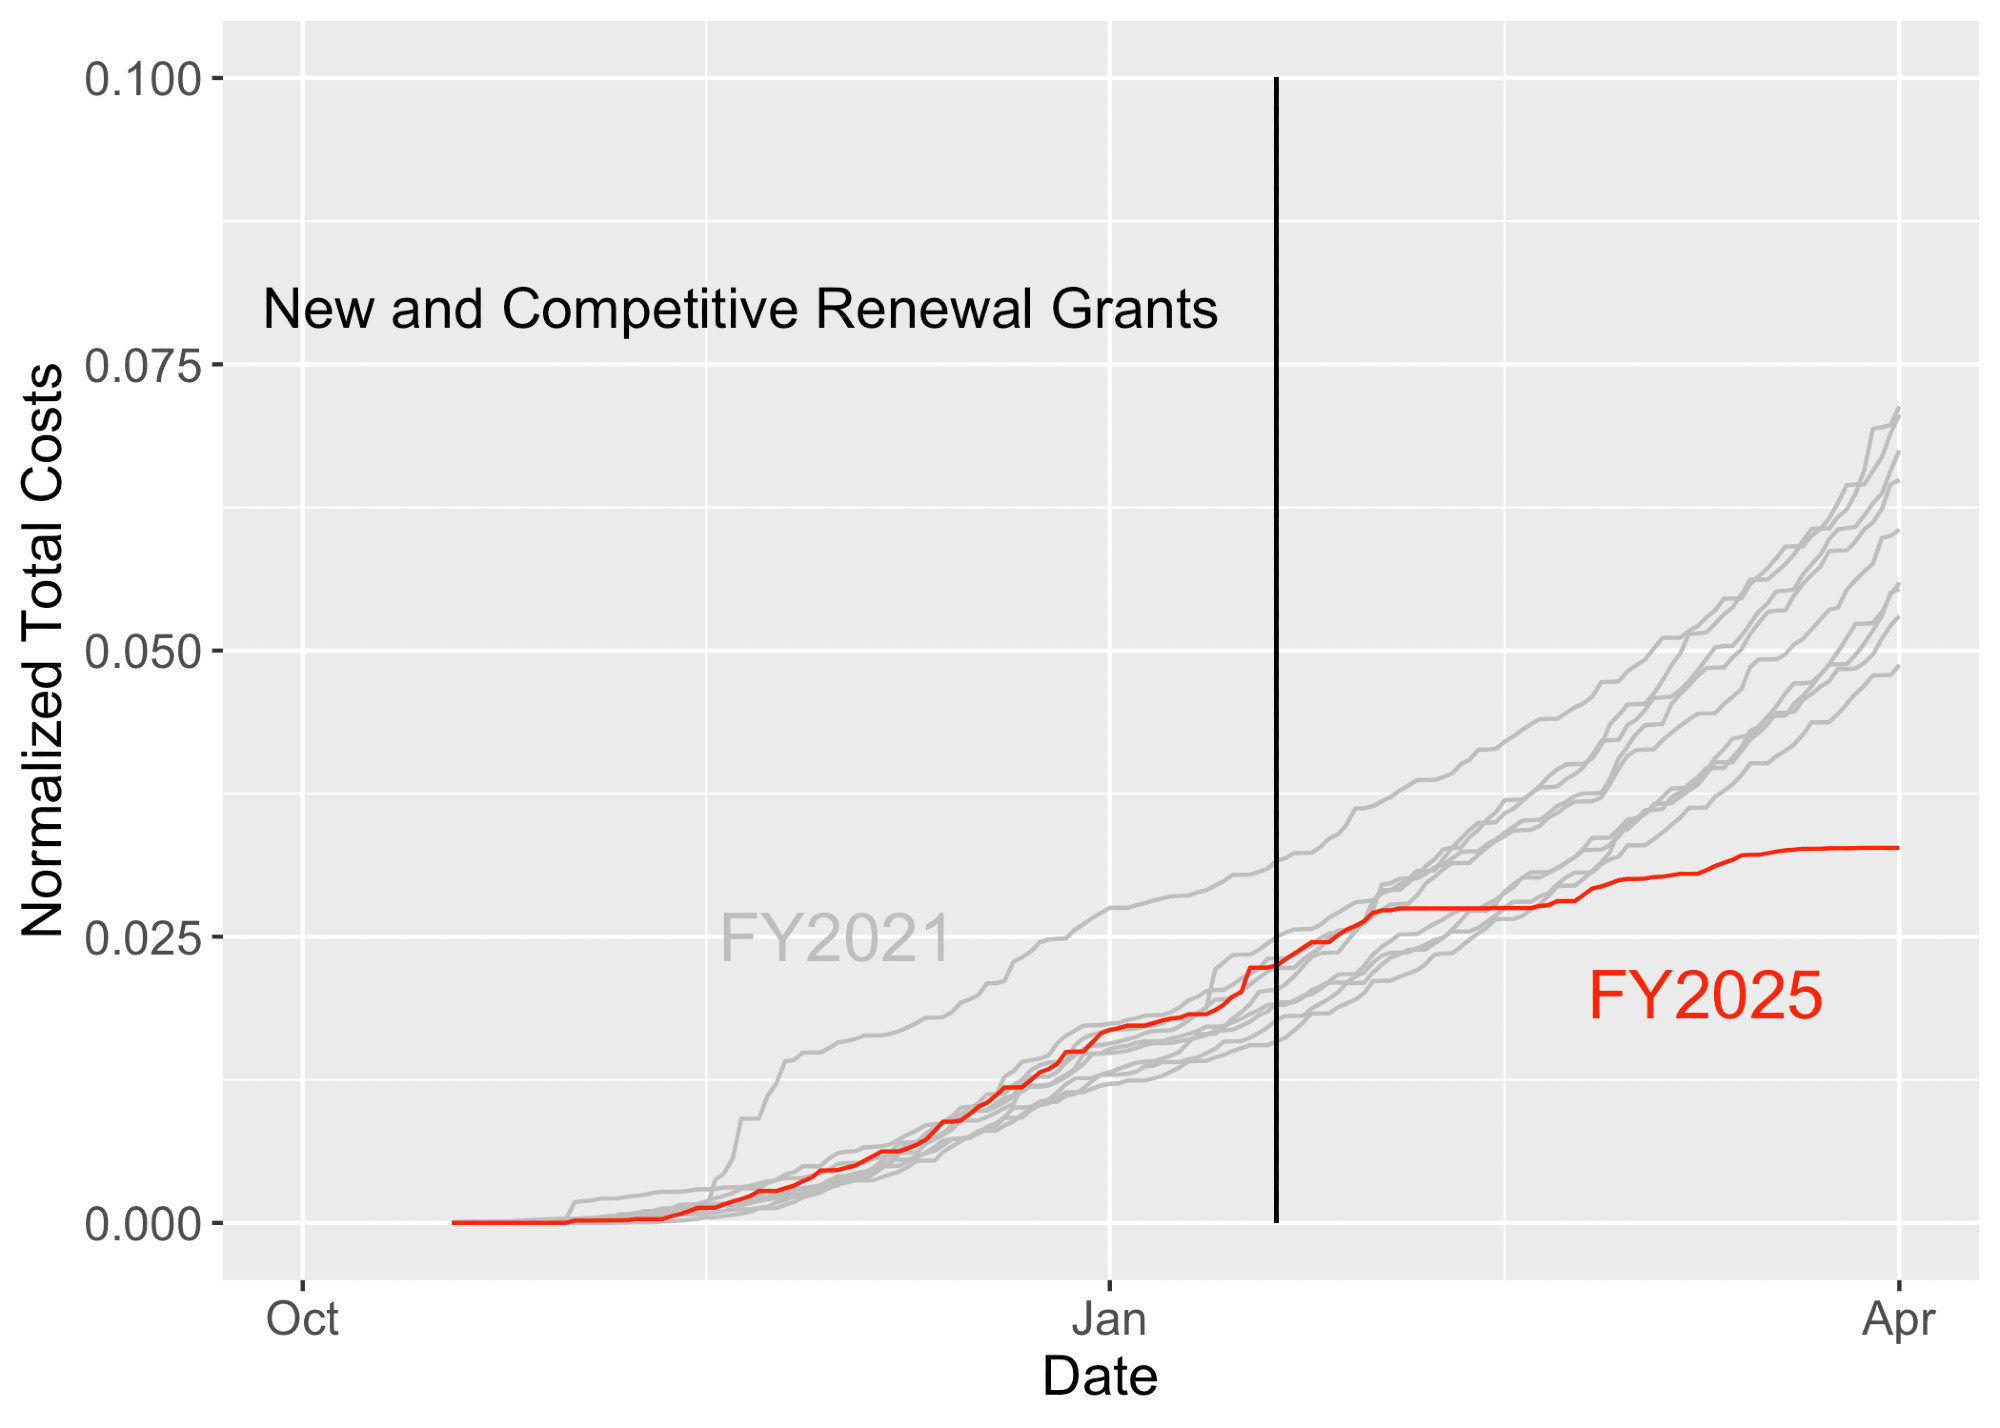
Here is the graph for new and competitive renewal grants (dollar amounts normalized by the overall NIH grant budget for each year_
1/2
Here is the graph for new and competitive renewal grants (dollar amounts normalized by the overall NIH grant budget for each year_
1/2
Comments
I will post the graphs on my dashboard (but not yet posted)
https://jeremymberg.github.io/jeremyberg.github.io/
The vertical lines in each graph correspond to January 20th.