
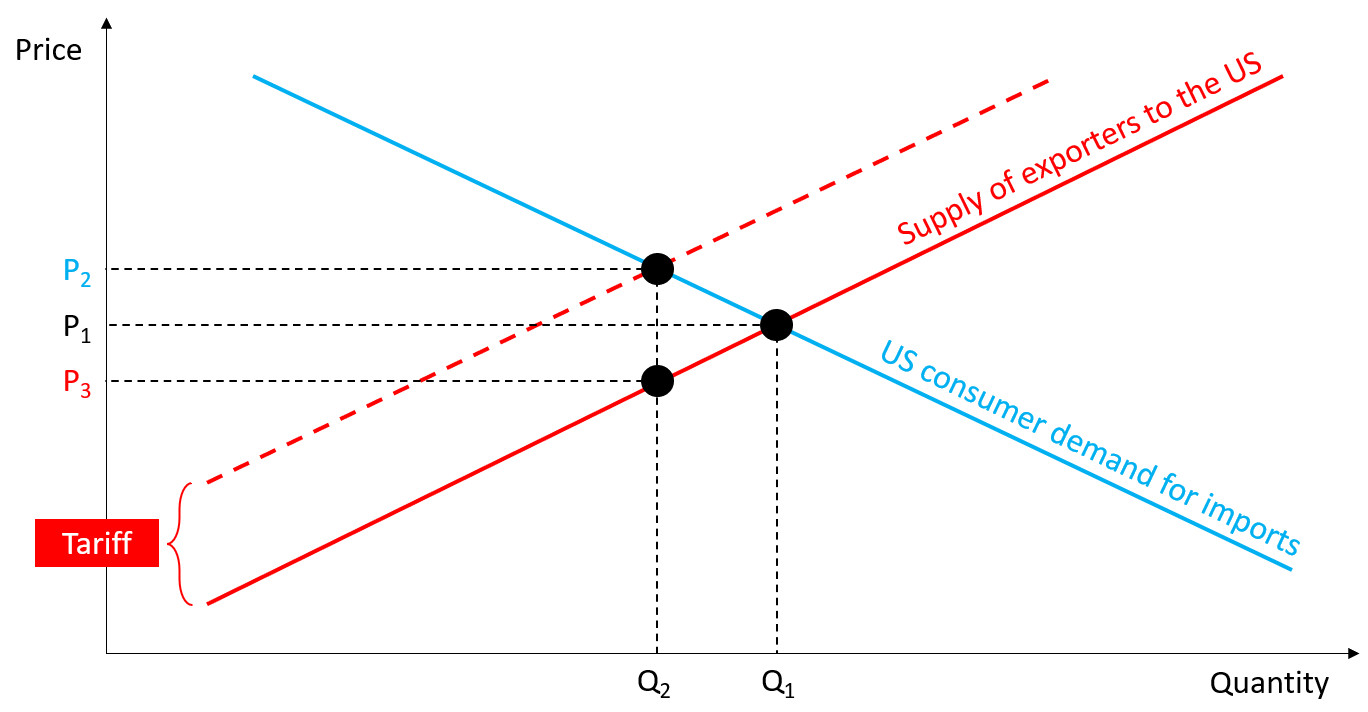
My graph on tariffs. Market starts at (P1, Q1). Trump slaps on tariff. Shifts the supply line of exporters up to the dash line. New equilibrium at a higher store price (P2). Also less goods consumed (Q2). Exporters also lose because their net price has dropped to P3, and they now sell only Q2.
Comments