
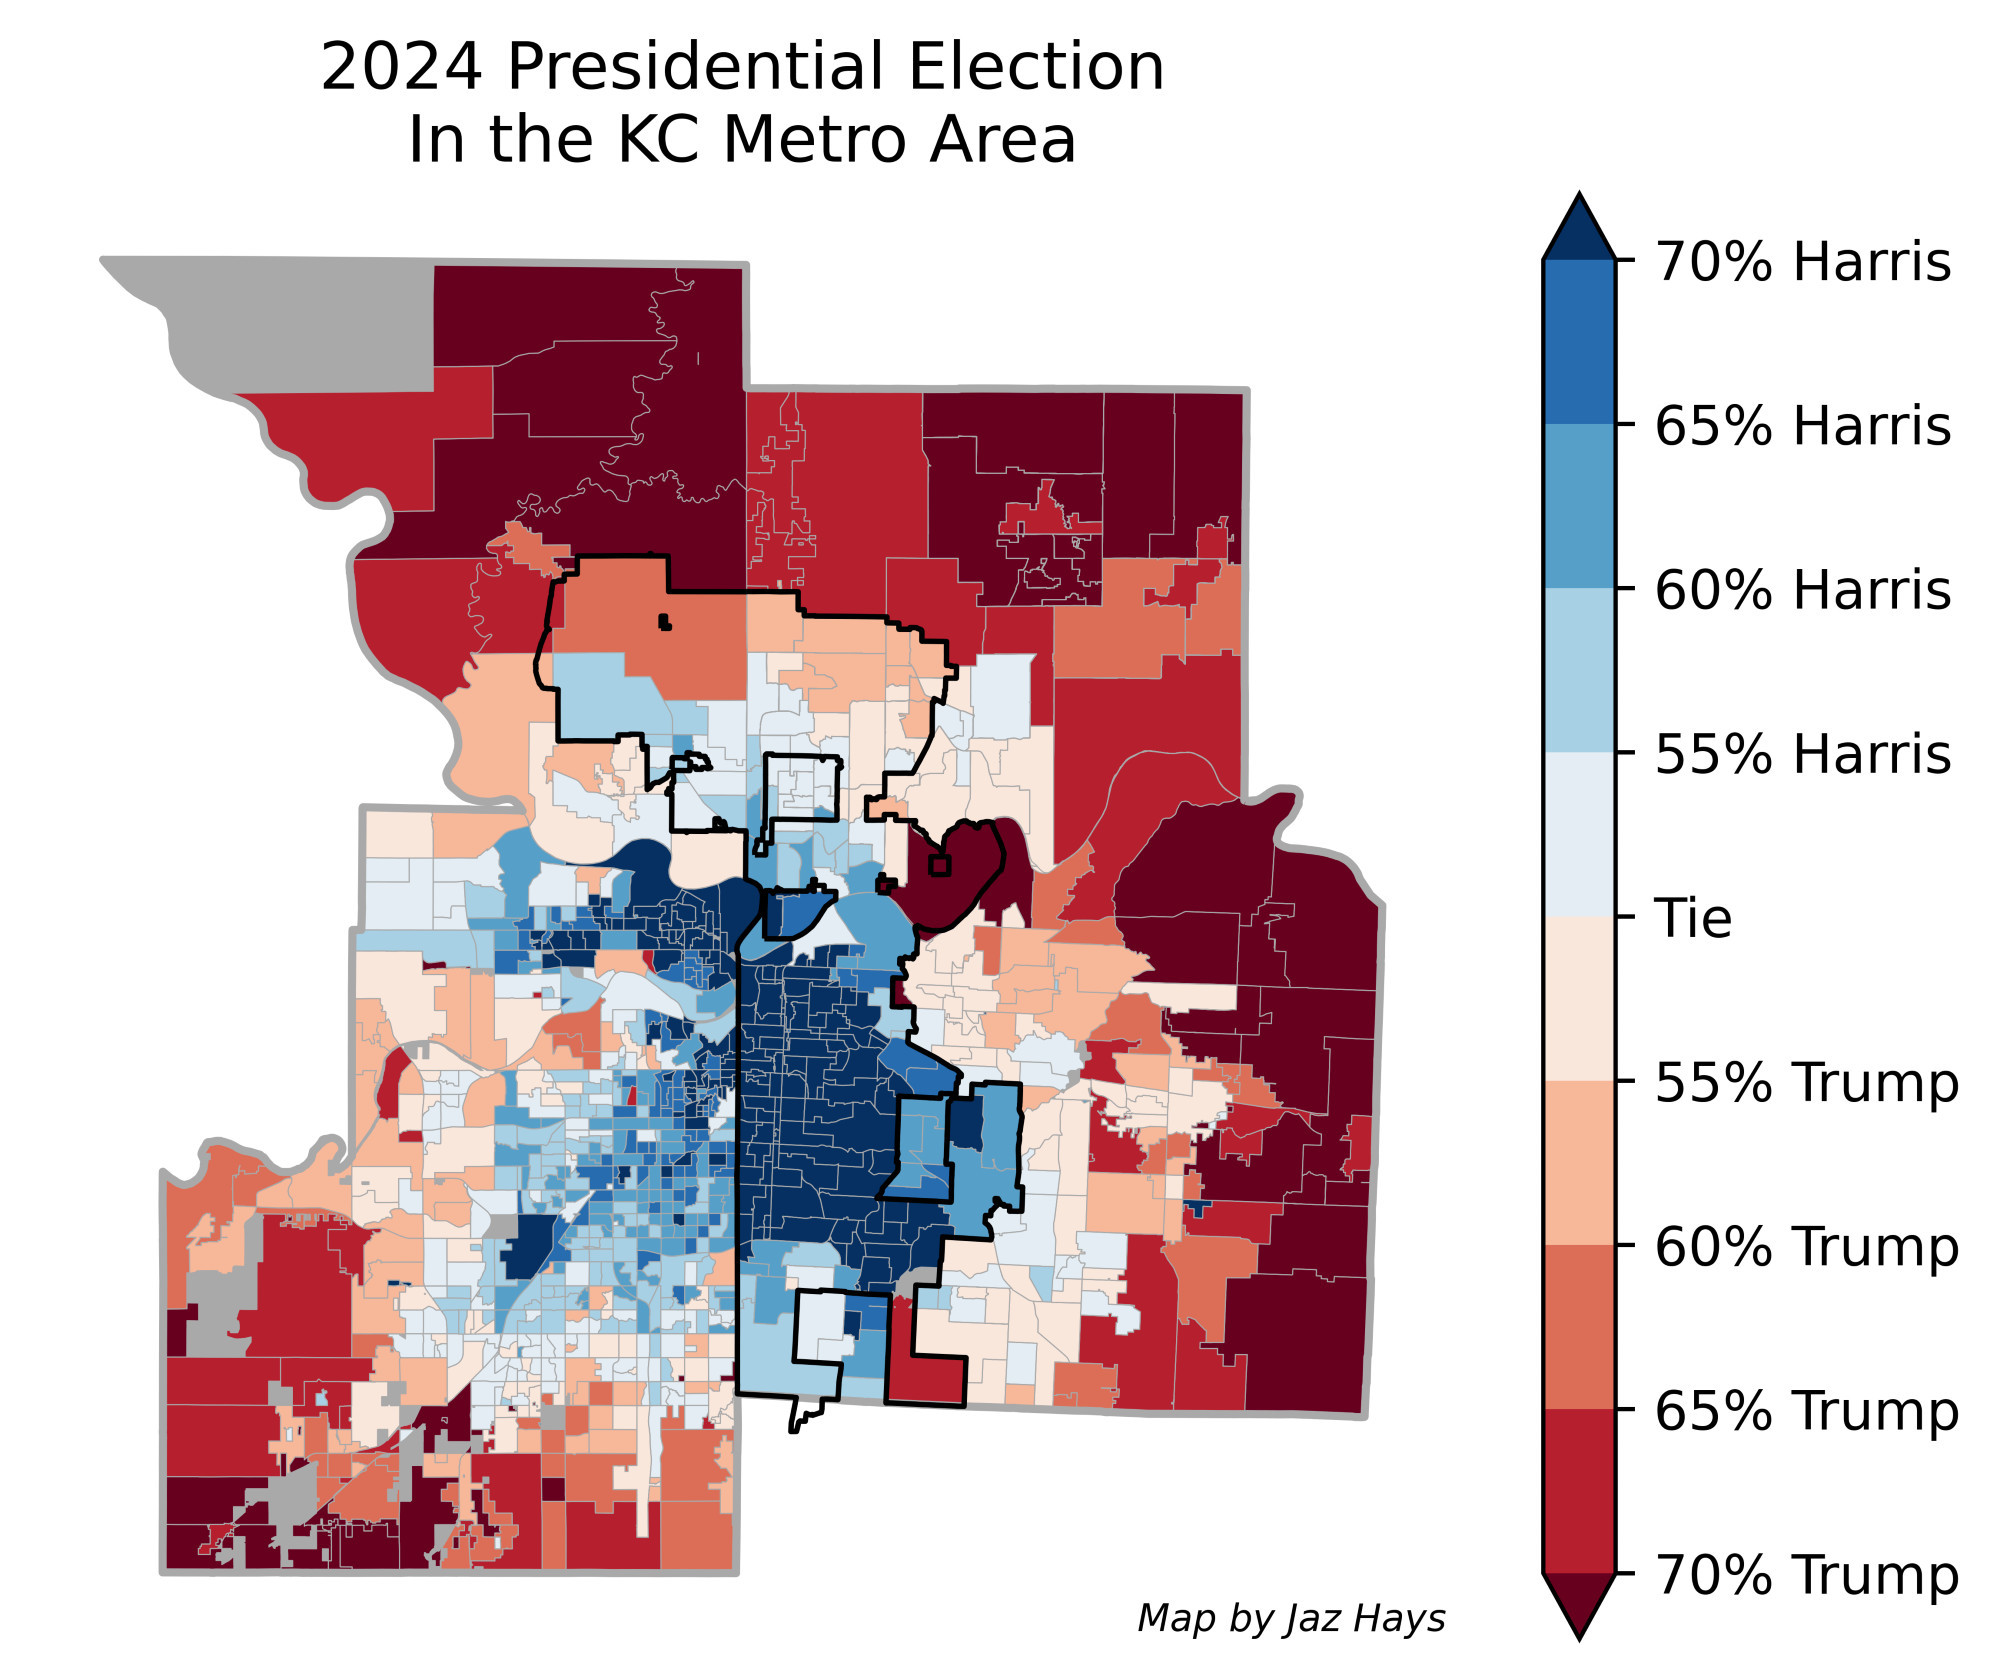
Here's the presidential election results mapped in the Kansas City metro area.
Half of the KC metro is in Missouri, where voters approved measures to legalize abortion and increase the minimum wage.
In this 🧵 you'll find maps of the ballot measures and a link to an interactive version of this map.
Half of the KC metro is in Missouri, where voters approved measures to legalize abortion and increase the minimum wage.
In this 🧵 you'll find maps of the ballot measures and a link to an interactive version of this map.
Comments
https://www.google.com/maps/d/edit?mid=1R1pxEfv3ByYjEHgbGzhWtEZI0DBwAyg
The only places that voted no in Jackson, Clay and Platte counties were generally unincorporated areas.
The measure was overwhelmingly approved in the KCMO metro area, even in areas with high Trump support.
So where are they?
That should generally correlate with the actual number of those voters. So I've mapped that to find any trends.
In most of the KC metro area, a minimum of about 20-30% of Trump voters voted to legalize abortion. There's no clear geographical trend of those voters.
It varies by jurisdiction. In most of these jurisdictions, I can calculate a very close estimate. But in Platte and JCEB jurisdiction, I can only estimate the non-absentee votes. For some reason, absentee votes there are reported as a "precinct"
But I can dig up my code for district-level estimates and try to run it especially for Clay, KCEB, Wyco and Joco.