I have a question. The approval graph is reporting approval rating from a combination of polls up to a size of 5,000 respondents and at least 100? Then, each poll is weighted by size? How do we understand how many respondents these graph represents?
(This isn't meant to sound heartless. It is devastating to have something you love shut down by a larger corp. But there are avenues forward. Esp in a moment like this, which does deeply need the work. For those able to be entrepreneurial, the paths exist.)
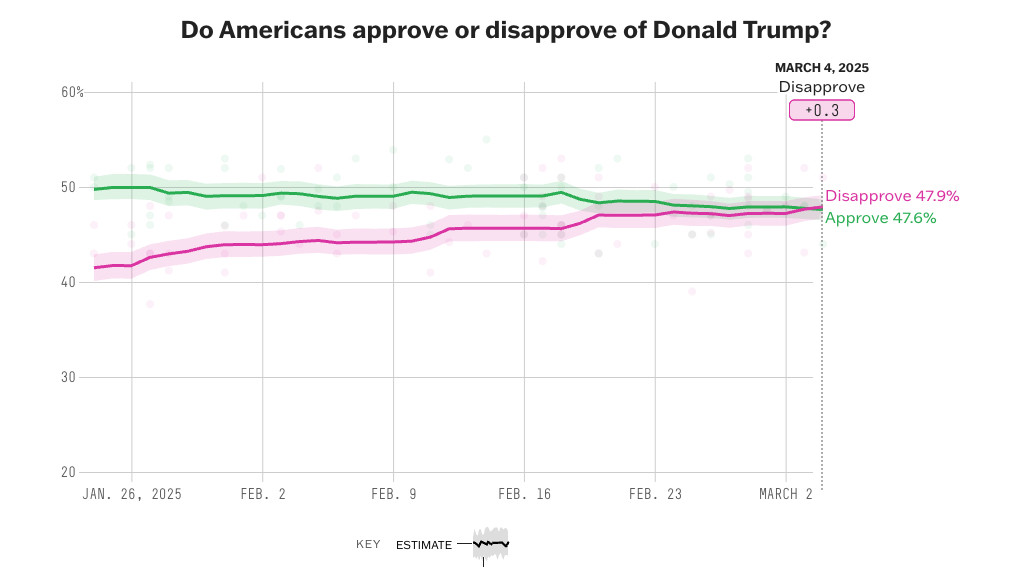
And boom. The timing is very suspicious or convenient, isn't it? Polling shows approval of Trump is net negative & suddenly entire 538 shut down immediately without warning & staff told not to publish anything new. Weird.

Comments
After all, Nate Silver started it as a solo project.
Take the idea, throw it up on Substack (where folks can immed start giving you $), & keep it going.
Yes I know you (Elliot) likely don't decide what goes on that page.